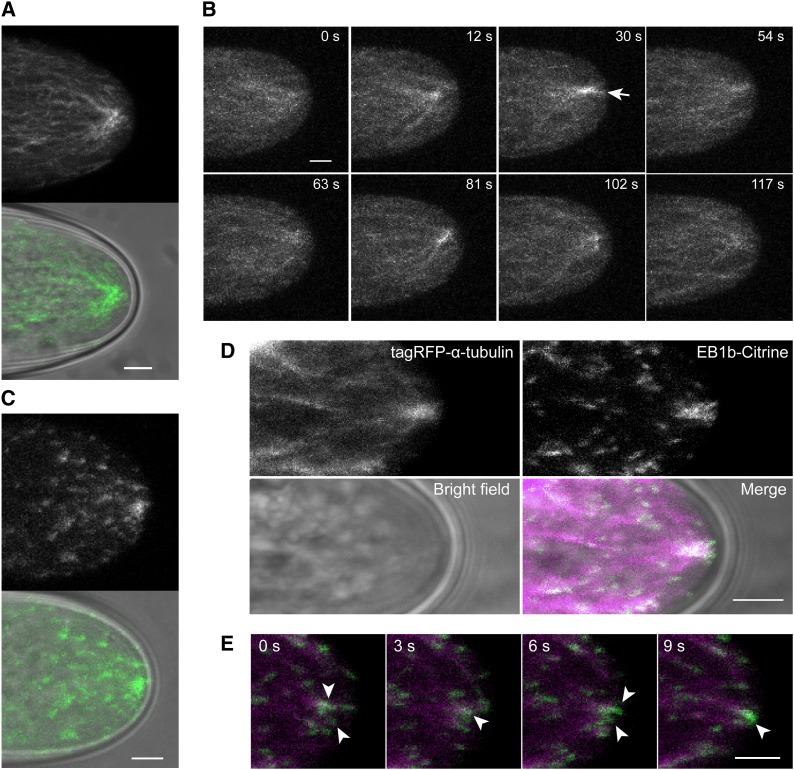
Figure 2.
Formation of Intense MT Bundles via the Merger of the Growing Plus Ends of the MTs in Growing Apical Domes.
(A) Distribution of sGFP-α-tubulin in the dome of a caulonemal apical cell. The images are maximum Z-projections of four planes (0.8-µm intervals). The top and bottom panels show an sGFP fluorescence image and a merged image of bright field (gray) and sGFP fluorescence (green), respectively.
(B) Dynamics of sGFP-α-tubulin in the apical dome of a caulonemal apical cell. The images were acquired every 3 min (Supplemental Movie 2), and representative images shown are maximum Z-projections of 10 planes (0.8-µm intervals). The arrow indicates an intense MT bundle.
(C) Distribution of EB1b-Citrine in the apical dome of a caulonemal apical cell. The images are maximum Z-projections of four planes (0.8-µm intervals). The top and bottom panels show a Citrine fluorescence image and a merged image of bright field (gray) and Citrine fluorescence (green), respectively.
(D) Distribution of TagRFP-α-tubulin and EB1b-Citrine in the apical dome of a caulonemal apical cell. The images are maximum Z-projections of three planes (0.8-µm intervals). The top left and right panels show TagRFP-α-tubulin and EB1b-Citrine fluorescence images, respectively. The bottom left and right panels show bight-field and merged images, respectively, of bright field (gray), TagRFP fluorescence (red), and sGFP fluorescence (green).
(E) Dynamics of TagRFP-α-tubulin and EB1b-Citrine in the apical dome of a caulonemal apical cell. The images are maximum Z-projections of four planes (0.8-µm intervals). The images were acquired every 3 min (Supplemental Movie 3). The TagRFP (red) and Citrine (green) fluorescence images are merged. Arrowheads indicate the growing plus ends of MTs converged with other growing plus ends in the apical dome.
Bars = 2 µm.

