Figure 5.
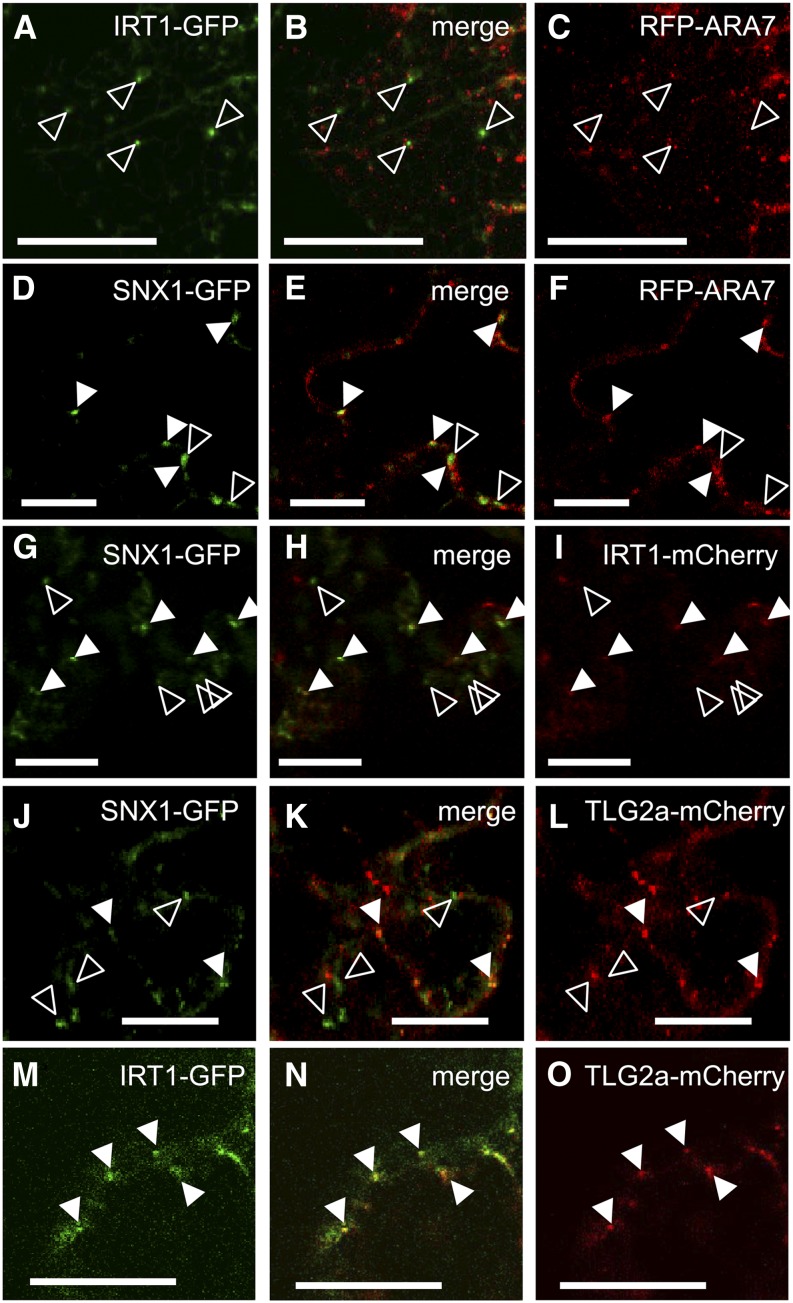
Colocalization between SNX1 and IRT1.
(A) to (C) Coexpression of IRT1-GFP (A) and RFP-ARA7 ([C]; late endosome marker). Open arrowheads show examples of signals in the green channel that do not correspond to signals in the red channel. Bars = 20 μm.
(D) to (F) Coexpression of SNX1-GFP (D) and RFP-ARA7 (F). Closed arrowheads show examples of colocalization, while open arrowheads show examples of signals in the green channel that do not correspond to signals in the red channel. Bars = 20 μm.
(G) to (I) Coexpression of SNX1-GFP (G) and IRT1-mCherry (I). Closed arrowheads show examples of colocalization, while open arrowheads show examples of signals in the green channel that do not correspond to signals in the red channel. Bars = 20 μm.
(J) to (L) Coexpression of SNX1-GFP (J) and TLG2a-mCherry ([L]; TGN/early endosome marker). Closed arrowheads show examples of colocalization, while open arrowheads show examples of signals in the green channel that do not correspond to signals in the red channel. Bars = 20 μm.
(M) to (O) Coexpression of IRT1-GFP (M) and TLG2a-mCherry (O). Closed arrowheads show examples of colocalization. Bars = 20 μm.
A minimum of 10 images per combination was analyzed.

