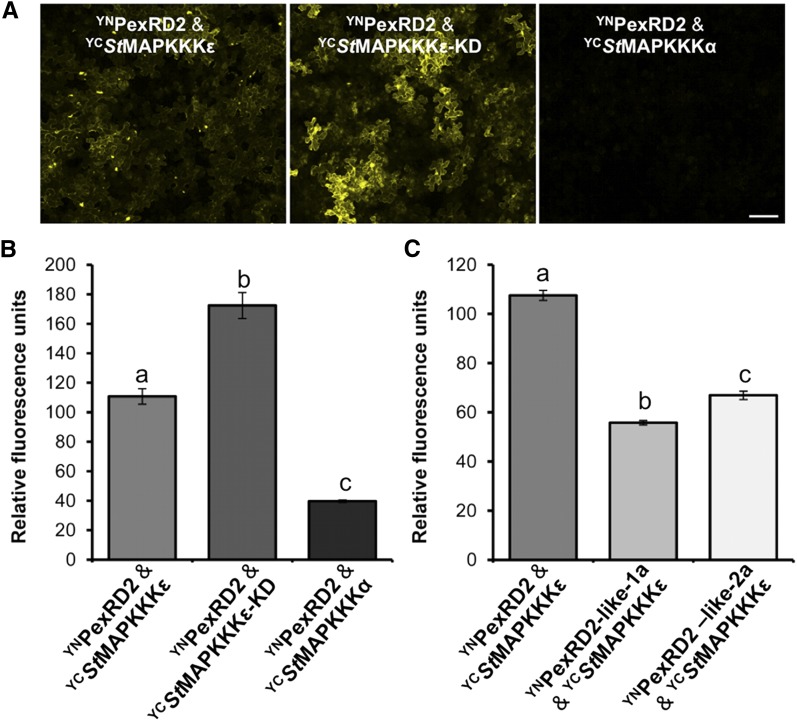
Figure 3.
PexRD2 and MAPKKKε Interact in the Plant Cell Cytoplasm.
(A) BiFC of YNPexRD2 with YCStMAPKKKε (left), YCStMAPKKKε-KD (middle), and YCSlMAPKKKα (right). Bar = 100 µm.
(B) Fluorimeter measurements of BiFC shown in (A), each from 36 independent samples.
(C) Fluorimeter measurements of BiFC between YN and YC fusion proteins as indicated, each from 36 independent samples. Results in (B) and (C) are the mean ± se, with the letters indicating values significantly different to each other (P < 0.001) as determined by one-way ANOVA.

