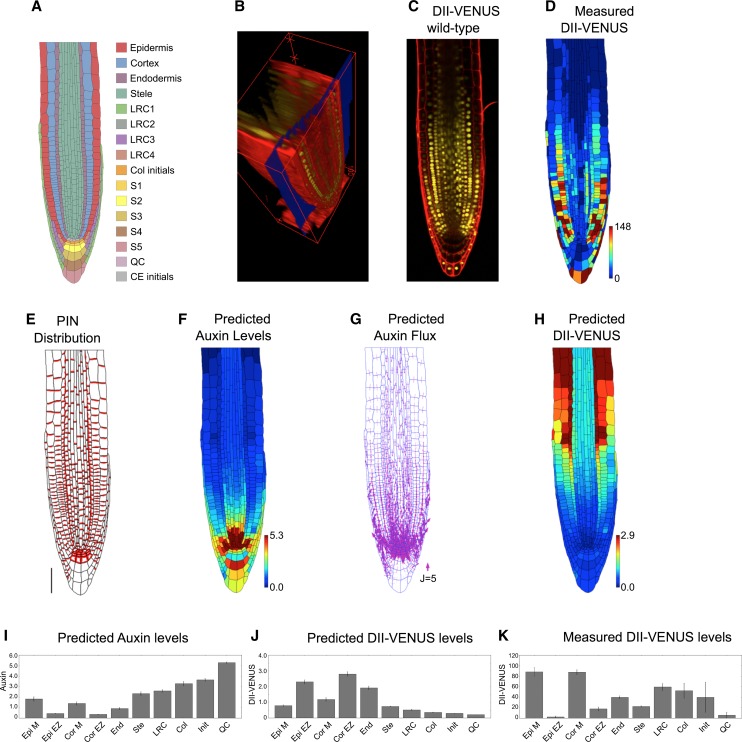
Figure 1.
Auxin Transport by the PIN Efflux Carriers Alone Does Not Produce the Auxin Distribution in the Root Tip.
(A) Schematic showing cell types labeled on the wild-type root geometry. CE, cortical/endodermal.
(B) 3D measuring plane (blue) through a confocal stack of images produced using SurfaceProject software.
(C) Output 2D interpolated slice, showing DII-VENUS (yellow) and cell geometries (red) within an Arabidopsis root tip (stained using propidium iodide).
(D) Measured DII-VENUS levels extracted from the confocal image shown in (C).
(E) Prescribed PIN distribution. Bar = 50 μm.
(F) Predicted auxin distribution.
(G) Predicted auxin fluxes (with arrow width scaling with flux).
(H) Predicted DII-VENUS distribution.
(I) Mean predicted auxin concentration in the different cell types.
(J) Mean predicted DII-VENUS concentration in the different cell types.
(K) Mean measured DII VENUS levels in the different cell types.
In (D), (F), and (H), the heat map upper limit is prescribed automatically to be the 95th percentile of the predicted/measured values in each case. In (I) to (K), error bars show 1 se. Epi, epidermis; Cor, cortex; End, endodermis; Ste, stele; Col, columella; Init, columella initials; M, meristem; EZ, elongation zone. Supplemental Table 1 lists the number of cells in each category.

