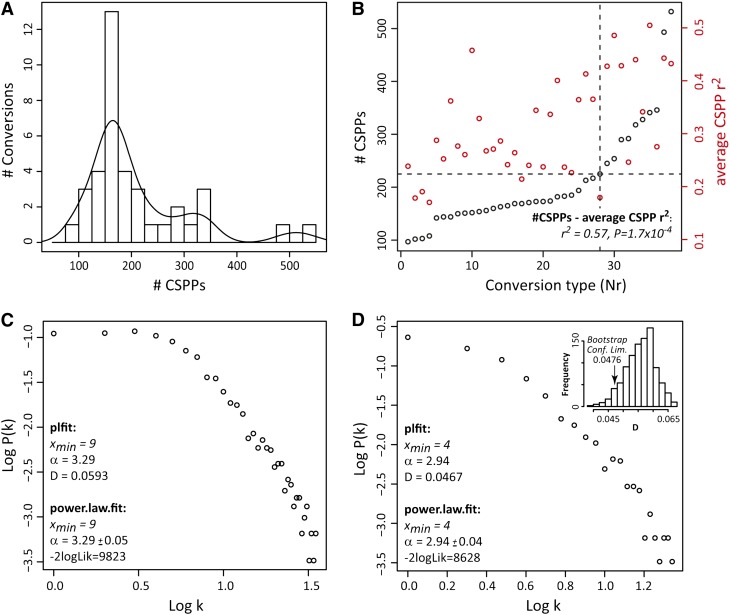
Figure 2.
CSPP Distribution Properties.
(A) Histogram of CSPP number. The curve represents a Gaussian kernel density function (weight = 40).
(B) CSPP number and average Pearson correlation coefficient versus the conversion type. (Bio)chemical conversions were ordered with increasing CSPP number (see Table 1, Nr). The dashed lines indicate the knot from which the CSPP number per conversion increases more steeply and all conversions represent well-known enzymatic reactions. A Pearson correlation coefficient was computed for each CSPP between its “substrate” and “product” levels (based on the MS ion current signal) across biological replicates. The correlation coefficients obtained for all CSPPs belonging to the same conversion were then averaged. The positive association between these average Pearson correlations and the number of CSPPs was also evaluated via a Pearson correlation (see r2 and P values inserted in the plot).
(C) and (D) Node connectivity distribution of CSPP networks. Log-log plot of network node connectivity distribution involving all reactions (C) and log-log plot of network node connectivity distribution involving only the “high CSPP number” conversions (D). The accuracy of the fit to a power law distribution for the log-log plots in (C) and (D) was computed via the plfit (D statistic) and power.law.fit (-2logLik) functions in R (see Methods). The significance of the better accuracy obtained for the log-log plot in D was tested via bootstrapping (inset; see Methods). -2logLik, −2 times the logarithm of the likelihood; Conf. Lim., one-sided confidence limit; D, Kolmogorov-Smirnov goodness-of-fit statistic; k, node connectivity or the number of edges a node possesses. α and xmin are estimates for the power law function parameters.

