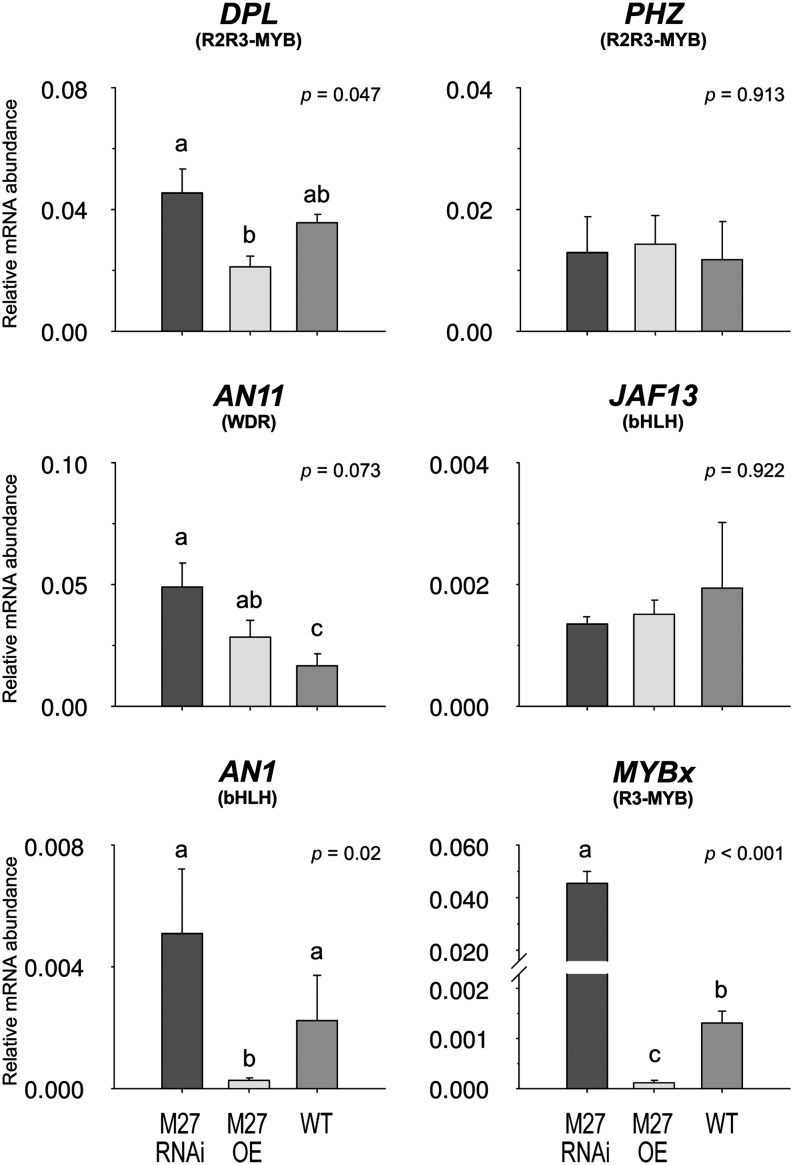
Figure 4.
MYB27 Regulates AN1 and MYBx Expression in Transgenic Petunias.
Transcript abundance for anthocyanin regulators in sepal tissue determined by qRT-PCR. Means ± se are shown for MYB27 RNAi or MYB27 OE transgenic lines and wild-type MP controls: n = 3 biological replicates consisting of independent lines; n = 2 for the wild type. Statistical significance was determined by one-way ANOVA (P values reported); significant differences between means (LSD, P = 0.05) are indicated where letters (a, b, and c) above the bar differ.

