
Figure 2.
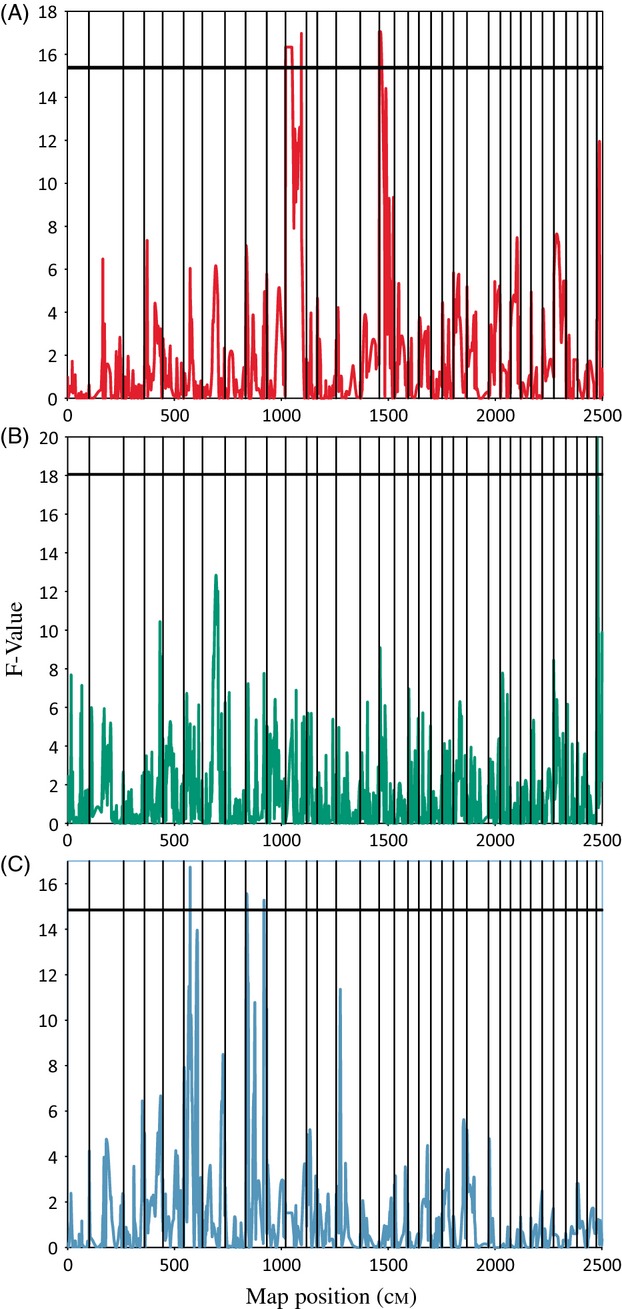
The distribution of F-values containing QTL significant at the experiment-wide level in the male (M7) and female (F14) parents. (A) F-values for thermotolerance in the male. (B) F-values for thermotolerance in the female F14. (C) F-values for body weight in the male. The dark horizontal line in all three figures is the experiment-wide (P < 0.05) significance threshold determined by a 10 000 permutation test (Churchill and Doerge 1994). Vertical lines designate individual linkage groups. Linkage group 11 on plot A contains two peaks, our model specified one QTL per linkage group, so only the higher of the two peaks was determined to be a QTL. QTL, Quantitative trait loci.