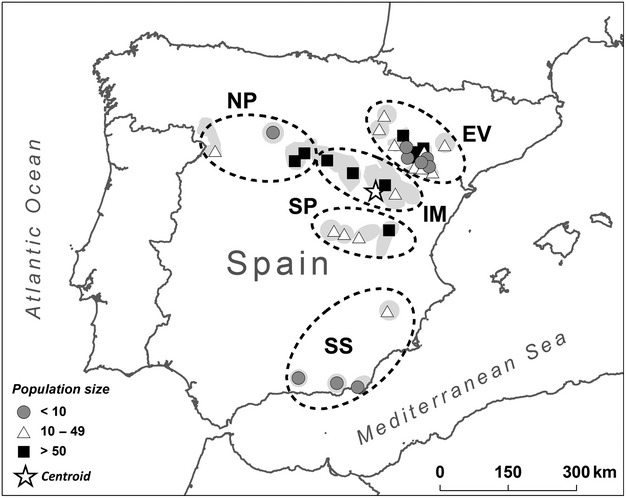
Figure 1.

Location of the sampled Dupont's lark local populations in Spain. Different symbols indicate different population sizes (number of territorial males). Dark grey areas show the approximate distribution of the Dupont's lark in Spain based on Suárez 2010 (discontinuities among neighbouring small patches are not shown at this scale). The centroid indicates the mean geographical centre of all populations. Dashed ellipses show the topographical areas identified by Laiolo and Tella (2006a): EV, Ebro Valley; NP, Northern Plateau; SP, Southern Plateau; IM, Iberian Mountains; SS, Southern Spain.
