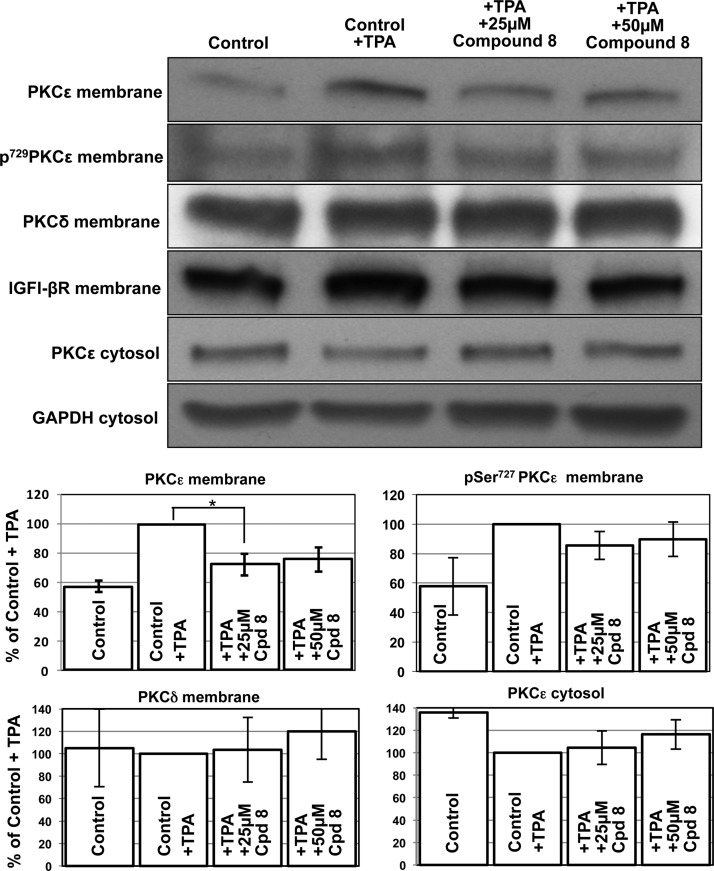
Figure 3.
Effect of 8 on PKCε and PKCδ translocation. IGFI-βR and GAPDH were used as loading controls for the membrane and the cytosolic fraction, respectively. In the densitometric analysis, four independent experiments were scanned and the mean values (±SD) are shown: (∗) p = 0.02. Depending on the exposure time of the membrane to the film, the bands vary from experiment to experiment. Therefore, the data were normalized to the control (100%) and no standard deviation can be reported.

