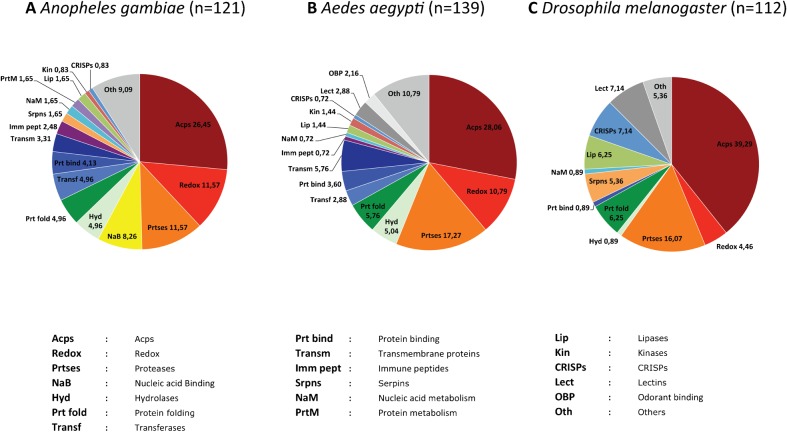
Figure 2.
Functional classes of MAG-specific genes in An. gambiae, Ae. aegypti, and D. melanogaster. The pie charts represent the functional classes of genes that are expressed in the male accessory glands of An. gambiae (A), Ae. aegypti (B), and D. melanogaster (C). Values indicate the percentage of genes that belongs to each class in the three species. These charts are based on published data derived from bioinformatics,34,42,69 transcriptional34,42,68,69,71 and proteomic34,43,68 analyses.

