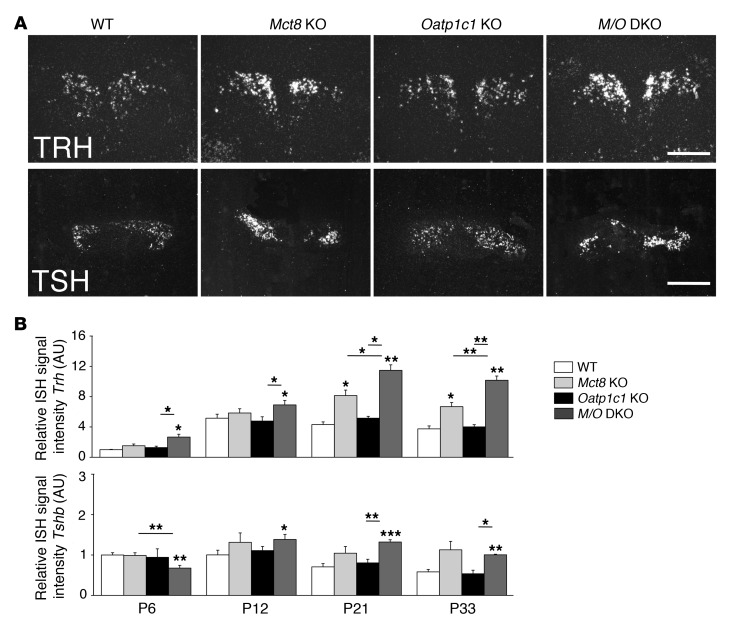
Figure 2. Postnatal development of the hypothalamus-pituitary axis.
Brains and pituitaries from male animals (n = 4 per genotype) were collected at different postnatal time points. Hypothalamic Trh and pituitary Tshb expression were assessed by ISH. (A) Darkfield illuminations of brain sections derived from P21 animals illustrated the increase in Trh and Tshb signal intensities in Mct8 KO versus Oatp1c1 KO and WT mice. Trh expression was even further upregulated in Mct8/Oatp1c1 DKO animals. Scale bars: 250 μm (Trh), 1 mm (Tshb). (B) This optical impression was confirmed by quantification of relative signal intensities. *P < 0.05, **P < 0.01, ***P < 0.001 vs. WT, or as otherwise indicated (brackets).

