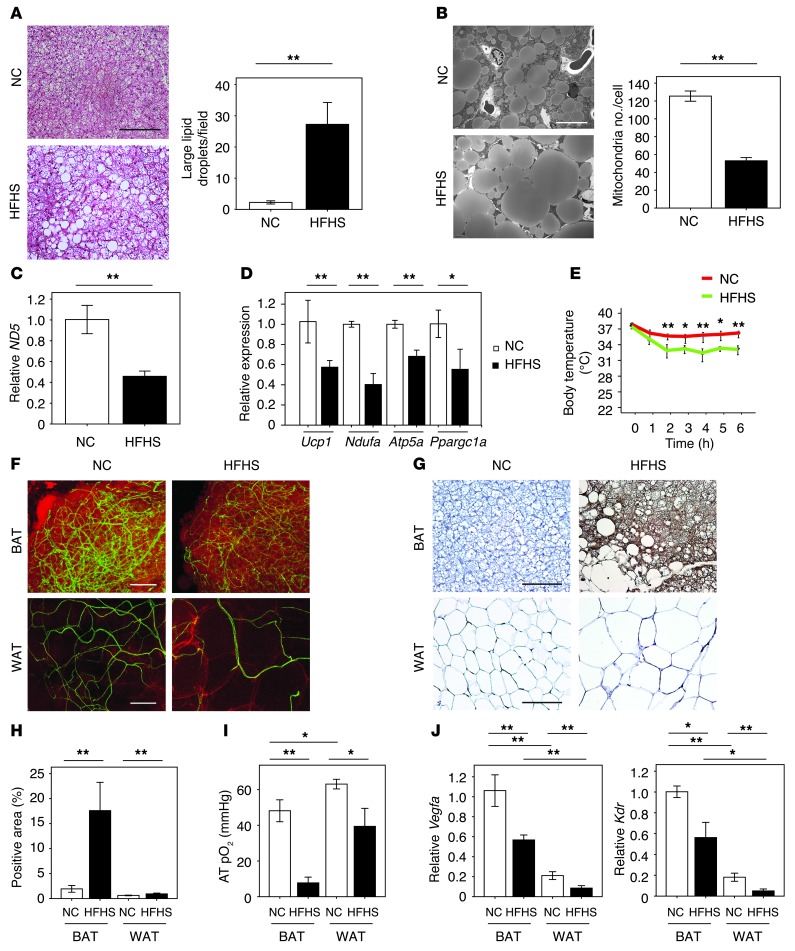
Figure 1. The whitening of BAT associated with capillary rarefaction in diet-induced obesity.
(A) H&E staining of BAT from mice fed NC or HFHS diet. Scale bar: 50 μm. Right graph shows the number of large lipid droplets/field in BAT (×400, n = 4). (B) Electron micrographs of BAT from mice fed NC or HFHS diet. Right graph shows the number of mitochondria/cell (n = 3). Scale bar: 10 μm. (C and D) Real-time PCR expression of the mitochondrial-encoded transcript ND5 and the nucleus-encoded transcripts Ucp1, Ndufa, Atp5a, and Ppargc1a in BAT from mice fed NC or HFHS diet (n = 3–6). (E) Acute CTT for mice fed NC or HFHS (n = 5–7). (F) Immunofluorescent staining to detect blood vessels with Fluorescein Griffonia (Bandeiraea) Simplicifolia Lectin I (green) and adipocytes with Bodipy-TR (red) in BAT and WAT from mice fed NC or HFHS diet. Scale bars: 100 μm. (G and H) Pimonidazole staining (G) and positive area (H) in BAT and WAT of mice fed NC or HFHS diet determined by hypoxyprobe-1 staining (n = 4–6). Scale bars: 50 μm. (I) Oxygen levels in adipose tissues (AT pO2 [mmHg]) (n = 5–6). (J) Real-time PCR expression of Vegfa and Kdr in BAT and WAT of mice fed NC or HFHS diet (n = 4–10). Data were analyzed by 2-tailed Student’s t test (A–D and H) or ANOVA (E, I, and J). *P < 0.05; **P < 0.01. All values represent the mean ± SEM.

