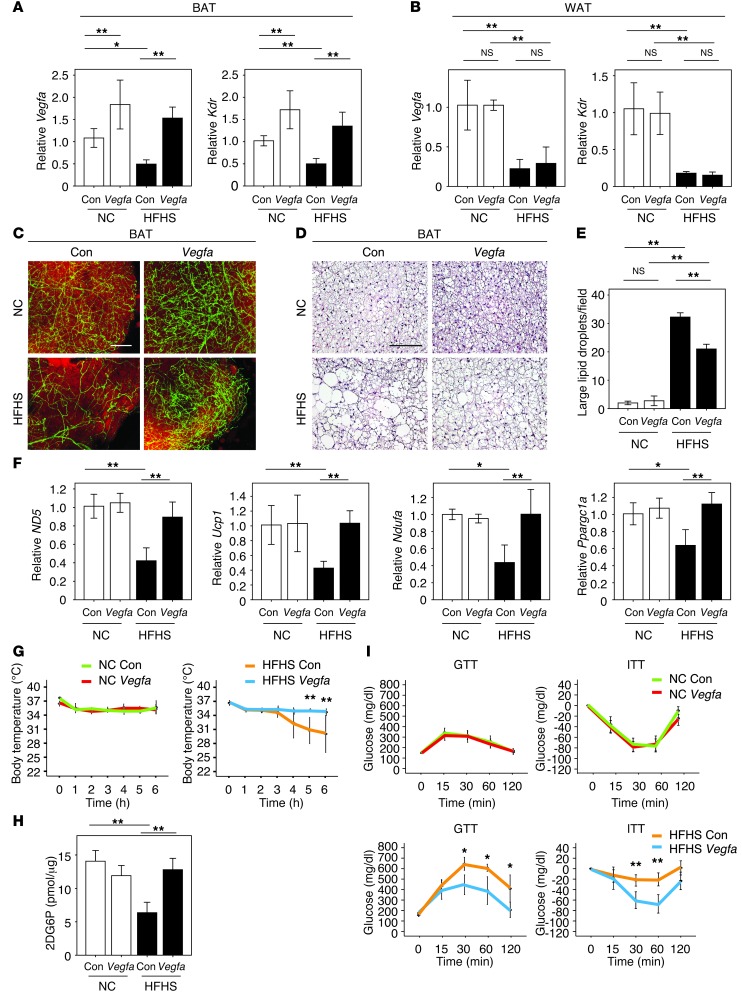
Figure 3. BAT-specific Vegfa delivery induces the rebrowning of the whitened BAT in dietary obesity.
(A and B) Real-time PCR analysis of Vegfa and Kdr expression in BAT (A) and WAT (B) of mice after injection of ad-vegfa or control vector into BAT of mice fed NC or HFHS diets. ad-lacZ was used as a control (Con) (n = 5–8). (C) Immunofluorescent staining with Fluorescein Griffonia (Bandeiraea) Simplicifolia Lectin I (green) to detect vasculature and with Bodipy-TR (red) to detect lipid in BAT from NC- or HFHS-fed mice after the injection of ad-vegfa of the control adenoviral vector. Scale bar: 100 μm. (D) H&E staining of BAT from NC- and HFHS-fed mice prepared in A after the injection of ad-vegfa or a control adenoviral vector. Scale bar: 50 μm. (E) Quantitative analysis of the number of large lipid droplets/field in BAT under the different experimental conditions (×400, n = 4). (F) Real-time PCR analysis of the expression of ND5, Ucp1, Ndufa, and Ppargc1a in BAT of mice described in A (n = 3–10). (G) Acute CTT of the different experimental groups of mice (n = 3–7). (H) Glucose uptake by BAT was evaluated by measuring 2DG uptake (n = 4–6). (I) GTT and ITT in the different experimental groups of mice receiving ad-vegfa or control adenovirus (n = 4–8). Data were analyzed by ANOVA (A, B, and E–I). *P < 0.05; **P < 0.01. All values represent the mean ± SEM.

