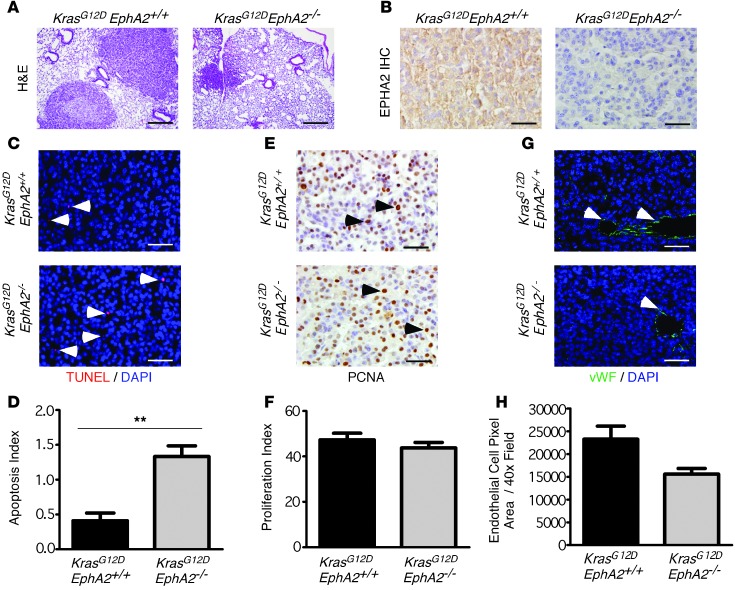
Figure 2. EphA2 deficiency results in increased apoptosis in KrasG12D tumors.
(A) H&E-stained lung sections (25 weeks) showing tumors derived from KrasG12DEphA2–/– mice relative to those derived from KrasG12DEphA2+/+ mice. Scale bar: 200 μm. (B) Loss of EPHA2 protein expression in tumors was confirmed by immunohistochemistry (IHC). Scale bar: 50 μm. (C) Apoptosis in tumor sections was measured by the TUNEL assay. TUNEL+ nuclei (red) are indicated with arrowheads. Scale bar: 50 μm. (D) Apoptosis was quantified as a percentage of TUNEL-positive nuclei relative to the total nuclei. Apoptosis index is presented as average percentage of TUNEL-positive nuclei per total nuclei ± SEM (n = 6 per genotype). (E) Tumor cell proliferation was assessed by PCNA immunohistochemistry. Arrowheads indicate representative proliferating nuclei. Scale bar: 50 μm. (F) Proliferation was quantified by assessing the total number of PCNA+ nuclei (brown) compared with the total nuclei. Proliferation index is presented as average percentage of PCNA-positive nuclei per total nuclei ± SEM (n = 6 per genotype). (G) Tumor vasculature was assessed by vWF immunofluorescence (green). Arrowheads indicate tumor microvessels. Scale bar: 50 μm. (H) Microvessels in the tumor were quantified by measuring vWF+ pixels in each tumor field ± SEM (P = 0.07) (n = 6 per genotype). **P < 0.01.

