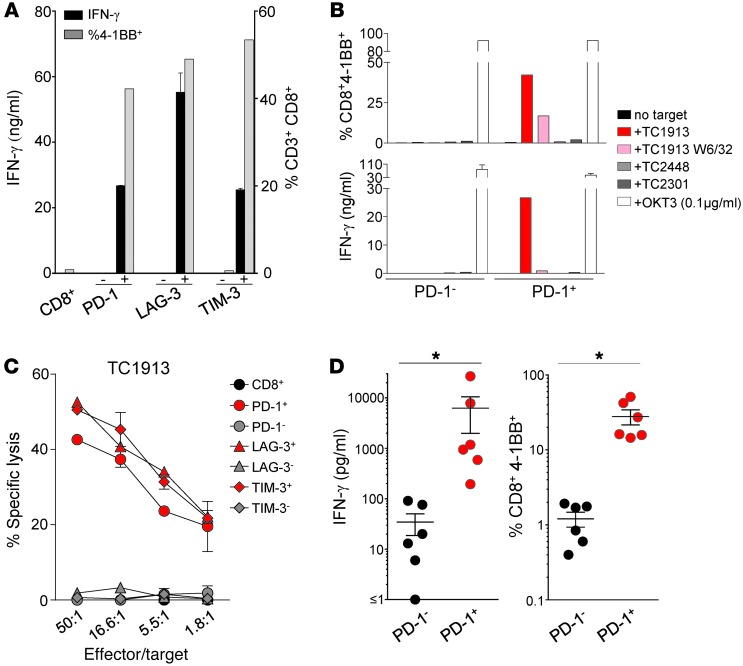
Figure 2. PD-1+, LAG-3+, and TIM-3+ derived CD8+ TILs, but not the negative counterparts, recognize and lyse their autologous tumor cell line.
Bulk CD3+CD8+ TILs were sorted to high purity from 6 tumors based on positive or negative expression of PD-1, LAG-3, and TIM-3 and expanded in vitro. (A) Response of FrTu1913-derived TILs to TC1913. TILs were cocultured with autologous TC1913, and tumor recognition was assessed by measuring IFN-γ release (duplicates, mean ± SD), and the frequency of CD8+4-1BB+ cells. (B) Reactivity of PD-1+ and PD-1– CD8+ TILs derived from FrTu1913 against a panel of targets: TC1913 with and without HLA-I blocking antibody (W6/32), TC2448 (matched HLA-A*0201), TC2301 (allogeneic), and plate-bound anti-CD3 (OKT3). Upregulation of 4-1BB (top) and IFN-γ release (bottom, duplicates, mean ± SD) are shown. (C) Lysis of TC1913 by FrTu1913-derived TILs. Cytotoxicity of TILs against TC1913 (mean ± SD). (D) Response of PD-1– and PD-1+ derived TILs to their autologous tumor targets from all the 6 fresh tumors studied. PD-1– and PD-1+ TILs were cocultured with their autologous tumor cell lines, and reactivity was assessed by measuring IFN-γ secretion (left) and 4-1BB upregulation (right). Each dot represents 1 patient’s sample. Mean ± SEM. *P ≤ 0.05, 2-tailed Wilcoxon signed-rank test.

