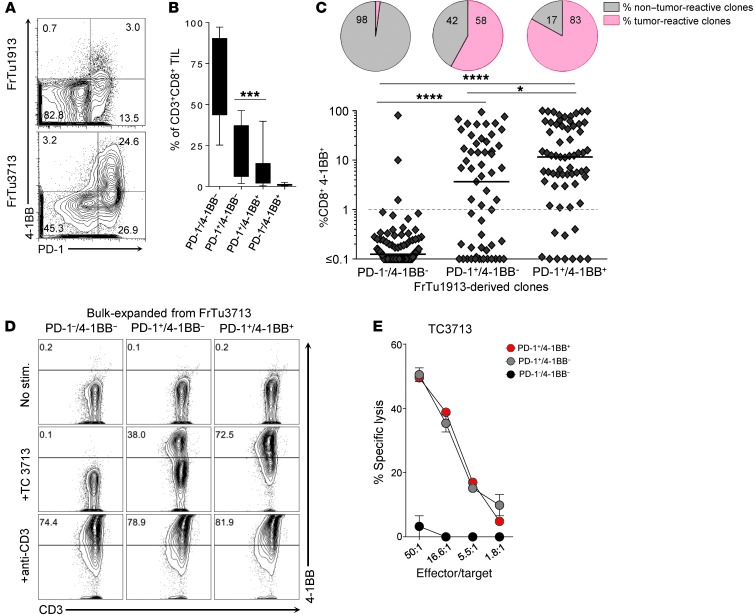
Figure 5. Expression of PD-1, rather than 4-1BB, more comprehensively identifies the repertoire of tumor-reactive cells in human tumors.
(A) Representative dot plots showing PD-1 by 4-1BB expression of CD8+ TILs infiltrating FrTu1913 and FrTu3713. (B) Expression of PD-1 by 4-1BB on CD8+ TILs infiltrating melanoma tumors. The frequency of each combination of markers is shown as mean ± SEM. ***P < 0.001, Wilcoxon signed-rank test (n = 24). (C) Response of FrTu1913-derived clones to TC1913. CD8+ TILs were sorted from FrTu1913 into PD-1–/4-1BB–, PD-1+/4-1BB–, and PD-1+/4-1BB+, and clones were established. Clones derived from PD-1–/4-1BB– (n = 96), PD-1+/4-1BB– (n = 57), and PD-1+/4-1BB+ (n = 65) were cocultured with TC1913; 4-1BB upregulation upon coculture is plotted for each clone. The line represents the median. *P ≤ 0.05, ****P ≤ 0.0001, Dunn test for multiple comparisons. Pie charts depict the percentage of tumor-reactive and non–tumor-reactive clones in each population. Greater than 1% CD8+4-1BB+ and greater than twice the background percentage 4-1BB compared with no stimulation control was considered positive. (D) Response of bulk-expanded FrTu3713-derived TILs to TC3713. CD8+PD-1–/4-1BB–, PD-1+/4-1BB–, and PD-1+/4-1BB+ TILs were sorted from FrTu3713 and expanded. Cells were either left unstimulated, cocultured with TC3713, or stimulated with plate-bound anti-CD3. 4-1BB upregulation was measured to assess tumor recognition. Representative dot plots of CD3+CD8+-gated cells are shown. (E) Lysis of TC3713 by TILs derived from FrTu3713.

