

Abstract
Inflammation is a major contributor to the development of atherosclerotic plaque, yet the involvement of liver and visceral adipose tissue inflammatory status in atherosclerotic lesion development has yet to be fully elucidated. We hypothesized that an atherogenic diet would increase inflammatory response and lipid accumulation in the liver and gonadal adipose tissue (GAT) and would correlate with systemic inflammation and aortic lesion formation in low-density lipoprotein (LDL) receptor null (LDLr−/−) mice. For 32 weeks, LDLr −/− mice (n = 10/group) were fed either an atherogenic (high saturated fat and cholesterol) or control (low fat and cholesterol) diet. Hepatic and GAT lipid content and expression of inflammatory factors were measured using standard procedures. Compared with the control diet, the atherogenic diet significantly increased hepatic triglyceride and total cholesterol (TC), primarily esterified cholesterol, and GAT triglyceride content. These changes were accompanied by increased expression of acyl-CoA synthetase long-chain family member 5, CD36, ATP-binding cassette, subfamily A, member 1 and scavenger receptor B class 1, and they decreased the expression of cytochrome P450, family 7 and subfamily a, polypeptide 1 in GAT. Aortic TC content was positively associated with hepatic TC, triglyceride, and GAT triglyceride contents as well as plasma interleukin 6 and monocyte chemoattractant protein-1 concentrations. Although when compared with the control diet, the atherogenic diet increased hepatic tumor necrosis factor α production, they were not associated with aortic TC content. These data suggest that the LDLr−/− mice responded to the atherogenic diet by increasing lipid accumulation in the liver and GAT, which may have increased inflammatory response. Aortic TC content was positively associated with systemic inflammation but not hepatic and GAT inflammatory status.
Keywords: Atherosclerosis, Inflammation, Liver steatosis, Gonadal adipose tissue, Atherogenic diet, Mice
1. Introduction
Cardiovascular disease caused by atherosclerosis is the leading cause of death in the United States and other developed countries [1]. Dietary fat type is an important variable related to the disease progression [2], although the roles and underlying mechanisms of Western-type diets (high in saturated fat and cholesterol) in the development of atherosclerosis and cardiovascular disease are not completely known [3–5]. Visceral adipose tissue and liver play an important role in lipid metabolism and inflammation [6,7]. In humans, excessive hepatic fat and visceral adipose tissue mass are positively associated with intima-media thickness of carotid arteries [8,9]. Excessive hepatic fat and visceral adipose tissue mass are also positively associated with systemic inflammation [10,11]. It is not known whether lipid content and inflammatory response in the liver and visceral adipose tissue, which are induced by an atherogenic diet, influence atherosclerotic lesion formation.
Pathologically, atherosclerotic plaque consists of macrophage infiltration, smooth muscle cell proliferation, lipid (primarily cholesterol) accumulation, and fibrous cap formation [12]. Historically, scientists have focused on improving blood lipid profiles to reduce aortic lesion formation. More recently, a preponderance of evidence from clinical and experimental studies suggests that inflammation plays a major role in the pathophysiology of atherosclerosis [13]. Luminal narrowing results in compromised blood flow that can only be partially compensated by vessel enlargement in an outward direction [12]. If inflammatory conditions and dyslipidemia persist, the cholesterol core expands, which is accompanied by an increased local inflammatory response [12]. Matrix metalloproteinases secreted by the activated inflammatory cells degrade the extracellular matrix, whereas localized inflammatory response inhibits the synthesis of new collagen [14]. These changes result in a thin, unstable fibrous cap. When the thin fibrous cap ruptures, thrombus formation is initiated. The thrombus can occlude blood flow and lead to death of the tissues fed by the artery. When a coronary artery is occluded, myocardial infarction occurs [12,14].
Inflammation plays an important role in atherosclerotic lesion development [12]. The major proinflammatory factors include interleukin 6 (IL-6) and tumor necrosis factor α (TNF-α), both of which can be released by adipose tissues [15]. Interleukin 6 is also released by hepatocytes and immune cells. Plasma IL-6 concentrations have been used as an indicator of humoral and cellular immune function [16,17]. Interleukin 6 can mediate the acute-phase response and stimulate the synthesis of C-reactive protein [18,19]. Tumor necrosis factor α is released from endothelial cells, smooth muscle cells, hepatocytes, adipocytes, and immune cells and plays an important role in the inflammatory response cascade by stimulating the synthesis of other cytokines [20,21]. Monocyte chemoattractant protein 1 (MCP-1) is a chemokine secreted by macrophages, activated endothelial cells, monocytes, and dendritic cells. It promotes the recruitment of monocytes into the inflamed tissues, which include the arterial wall, hepatic, and adipose tissues; increases the inflammatory response in those tissues; and facilitates atherosclerotic lesion development [22].
We have previously reported that, as compared with a control diet (low total and saturated fat and cholesterol), an atherogenic diet (high total and saturated fat and cholesterol) significantly increased plasma low-density lipoprotein cholesterol (LDL-C), TNF-α, IL-6, and MCP-1 concentrations and macrophage deposition in the aortic wall in LDL receptor null (LDLr−/−) mice [23]. These changes were associated with increased aortic lesion formation [23]. Expanded visceral adipose tissue functions as an endocrine organ. Both enlarged adipocytes and infiltrated macrophages promote inflammation resulting in an increased release of inflammatory factors, including MCP-1, TNF-α, and IL-6 and free fatty acids [11,15]. These factors activate inflammatory pathways in other tissues, particularly the liver. Free fatty acids released from the visceral adipose tissue are taken up by liver and other organs or tissues for energy production through β-oxidation; synthesis of complex lipids, such as triglycerides, phospholipids, and cholesterol; and ketone body formation. Triglycerides are stored in the hepatocytes or assembled into very LDL particles and secreted into the bloodstream. When hepatic triglyceride synthesis exceeds rates of oxidation and secretion, it results in the development of nonalcoholic fatty liver disease [24]. Excess accumulation of hepatic triglyceride promotes the release of inflammatory factors, which further increase systemic inflammation. Gonadal adipose tissue (GAT) is the major visceral fat depot in mice [25]. Liver and GAT play an important role in regulating lipid metabolism and inflammation, which may partially contribute to atherosclerotic lesion progression.
The aim of this study was to assess the effect of liver and GAT on systemic inflammation and atherosclerotic lesion formation. We hypothesized that the atherogenic diet would increase inflammatory response and lipid accumulation in the liver and GAT, which would correlate with systemic inflammation and aortic lesion formation in LDLr−/− mice. The LDLr−/− mouse was used because this is one of the commonly used atherosclerosis animal models. To test the hypothesis, the primary objectives were to measure the messenger RNA (mRNA) expression levels and protein concentrations of TNF-α, IL-6, and MCP-1 in the liver and GAT and to determine their relationship to aortic cholesterol content as a measure of atherosclerosis. We also measured the lipid content in the liver and GAT to determine their relationship to aortic cholesterol content and mRNA expression levels of lipid metabolism genes in the liver and GAT to investigate the underlying mechanisms.
2. Methods and materials
2.1. Animals and diets
Twenty male, 8-week-old LDLr−/− mice (Jackson Laboratory, Bar Harbor, ME, USA), initially weighing 20.2 ± 2.8 g, were placed in individual cages in a windowless room that was maintained at 22 to 24°C, 45% relative humidity, and with a daily 10/14 light/dark cycle (light period from 0600 to 1600 hours).
After 1 week of acclimation, the mice were randomly assigned to 1 of 2 groups based on their body weight. For 32 weeks, one group of mice (n = 10) was fed a control diet (4% butter fat, wt/wt, 9% energy; 0.02% cholesterol, wt/wt), and the other group of mice (n = 10) was fed an atherogenic diet (20% butterfat, wt/wt, 38% energy; 0.2% cholesterol, wt/wt). Mice were provided water and diets ad libitum. During the 32-week feeding period, body weight and food intake were monitored weekly. The atherogenic diet was previously shown to induce atherosclerotic lesion formation in LDLr−/− mice [26]. The atherogenic diet was modified from Harlan Teklad atherogenic diet TD.88137, as previously described [23]. After fasting for 16 to 18 hours, the mice were anesthetized with CO2 and euthanized by exsanguination. Serum and plasma were obtained by blood centrifugation at 1100 × g at 4°C for 25 minutes. Liver and GATs were snap-frozen into liquid nitrogen and stored at −80°C until analysis. The animal protocol was approved by the Animal Care and Use Committee of the Jean Mayer USDA Human Nutrition Research Center on Aging at Tufts University and was in accordance with guidelines provided by the National Institutes of Health Guide for the Care and Use of Laboratory Animals.
2.2. Serum lipid profile, plasma concentrations of inflammatory factors, and atherosclerotic lesion quantification
Serum triglyceride, total cholesterol (TC), and high-density lipoprotein cholesterol (HDL-C) concentrations were measured using an Olympus AU400 analyzer with enzymatic reagents (Olympus America, Melville, NY, USA) and reported as previously described [23,27]. Non–HDL-C was calculated as the difference between TC and HDL-C. Plasma TNF-α, IL-6, and MCP-1 concentrations were measured using Quantikine enzyme-linked immunosorbent assay kits (R&D Systems, Minneapolis, MN, USA) [27], and aortic TC was quantified using a gas chromatography system, both as previously described [27]. These data, addressing a different experimental question, have been previously published [23].
2.3. Liver and GAT fatty acid profiles
After the addition of heptadecanoic acid (C17:0) as an internal standard, tissue lipids (approximately 50 mg) were extracted overnight from homogenized liver and gonadal adipose tissue samples using 6 mL of chloroform/methanol/BHT(2:1:100, v/v/w), after addition of heptadecanoic acid (C17:0) as an internal standard [28]. The protein precipitate was removed by centrifugation (2500g, 5 mins, 4°C). Then 1.5mL of 0.88% potassium chloride was added to the supernantent, shaken vigorously and the layers were allowed to settle for 5 minutes. The upper layer was discarded and 1ml of distilled water:methanol (1:1 v/v) was added, the tube was shaken again and the layers allowed to settle for 15 minutes. The lower layer was transferred into a clean tube and evaporated to dryness under nitrogen. The samples were saponified by adding 2ml of 0.5N methanolic sodium hydroxide and incubating at 95°C for 15 minutes, and then were methylated by adding 2ml of 14% boron trifluoride-methanol and incubating at 95°C for 1 hour (2). The supernatant containing the fatty acid methyl esters (FAME’s) was dried down under nitrogen, resuspended in 100ul of hexane, transferred into amber GC vials and stored at −20°C until the time of analysis.
The liver and gonadal adipose tissue FAMEs were analyzed using an Autosystem XL gas chromatograph (Perkin Elmer, Boston, MA) equipped with a 30m × 0.25mm i.d (film thickness 0.25μm) capillary column (HP INNOWAX, Agilent Technologies, DE). Injector and flame ionization detector temperatures were 250° and 260°C, respectively. Helium was used as the carrier gas (2mL/min) and the split ratio was 2:1. The oven temperature was programmed at 80°C, held for 2 minutes and then increased to 160°C at a rate of 10°C/minute. After 5 minutes, the temperature was increased to 222°C at a rate of 2°C/minute, held for 5 minutes. The final temperature was 252°C, held for 5 minutes. Peaks of interest were identified by comparison with authentic fatty acid standards (Nu-Chek Prep, Inc. MN) and expressed as molar percentage (mol %) proportions of fatty acids relative to the internal standard [28,29].
2.4. Liver and GAT lipid content
Using a chloroform/methanol mixture (2:1, vol/vol), lipids were extracted from approximately 50 mg of frozen tissue. After drying the lipids using nitrogen gas, they were dissolved into deionized water that contained 2% triton X-100. TC, free cholesterol (FC), and triglyceride concentrations were measured using Wako assay kits (Wako Chemicals, Richmond, VA, USA). Esterified cholesterol (EC) was calculated as the difference between TC and FC. The tissue pellet was digested by 1 N NaOH, and total protein was measured using a bicinchoninic acid kit (Pierce Ins, Rockford, IL, USA). Lipid content was expressed as milligrams per milligram of protein.
2.5. Liver histologic scoring
Liver histologic scoring was performed at the Department of Pathology at Texas Tech University Health Sciences Center. Frozen liver tissue was fixed overnight in a 10% neutral-buffered formalin. The sections were submitted in plastic cassettes for routine histology processing and embedding. Sections were cut at 4-μm thickness, stained by hematoxylin and eosin, dehydrated, and coverslipped. Photographs were taken using a DP72 digital camera (Olympus). Images were processed using the DP2-BSW package (Olympus), under standard settings without further adjustment. Samples were scored using a semiquantitative scale 0 to 3 (0, no macrovesicular change; 1, mild macrovesicular change; 2, moderate macrovesicular change; 3, severe macrovesicular change) as graded in blinded fashion by a pathologist (B.M.) after examination of 10 randomly chosen 4× and 10× fields. Scores were recorded on an Excel spreadsheet.
2.6. RNA extraction and real-time polymerase chain reaction
RNA was extracted from hepatic and GAT using an RNeasy minikit (Qiagen, Valencia, CA, USA). Complementary DNA was synthesized from RNA using SuperScript II reverse transcriptase, according to the manufacturer’s instructions (Invitrogen, Carlsbad, CA, USA). Primers for acyl-CoA synthetase long-chain family member 5 (ACSL5); stearoyl-coenzyme A desaturase 1; cytochrome P450, family 7, subfamily a, polypeptide 1 (CYP7α1); fatty acid–binding protein 5 (FABP5); scavenger receptor type A 1; sterol regulatory element binding transcription factor 1; fatty acid synthase (FASN); 3-hydroxy-3-methylglutaryl-coenzyme A reductase (HMGCR); acetyl-coenzyme A carboxylase α (ACACA); scavenger receptor class B, member 1 (SR-B1); ATP-binding cassette, subfamily A, member 1 (ABCA1); CD36; CD68; F4/80; IL-6; MCP-1; TNF-α, and β-actin (Table 1) were designed using Primer Express version 2.0 (Applied Biosystems, Foster City, CA, USA). β-Actin was used as an endogenous control. Primer amplification efficiency and specificity were verified for each set of primers. Complementary DNA levels of the genes of interest were measured using power SYBR green master mix on real-time polymerase chain reaction 7300 (Applied Biosystems). The reaction condition was 95°C for 10 minutes, 40 cycles of 95°C for 15 seconds, and 60°C for 1 minute, with 1 cycle of dissociation stage. Messenger RNA fold change was calculated using the 2(−delta delta C(T)) method [30].
Table 1.
Mouse oligonucleotide sequences of primers
| Gene name | NCBI genbank | Forward primer | Reverse primer |
|---|---|---|---|
| SRA | AF203781 | TCTACAGCAAAGCAACAGGAGG | TCCACGTGCGCTTGTTCTT |
| SR-B1 | NM_016741 | TGGAACGGACTCAGCAAGATC | AATTCCAGCGAGGA TTCGG |
| CD36 | NM_007643 | ATTAATGGCACAGACGCAGC | CCGAACACAGCGTAGATAGACC |
| ABCA1 | NM_013454 | CCTGCTAAAATACCGGCAAGG | GTAACCCGTTCCCAACTGGTTT |
| ACACA | NM_133360 | TGGTTTGGCCTTTCACATGAG | GCTGGAGAAGCCACAGTGAAAT |
| HMGCR | NM_008255 | CATCATCCTGACGATAACGCG | AGGCCAGCAATACCCAGAATG |
| FASN | NM_007988 | AGTTGCCCGAGTCAGAGAACCT | CATAGAGCCCAGCCTTCCATCT |
| SREBF1 | NM_011480 | TTGAGGATAGCCAGGTCAAAGC | GGATTGCAGGTCAGACACAGAA |
| ACSL5 | NM_027976 | AAGACGATCATCCTCATGGACC | CCTATATTCTCCGCATCATGCA |
| SCD1 | NM_009127 | AAGCTCTACACCTGCCTCTTCG | GCCTTGTAAGTTCTGTGGCTCC |
| CYP7α1 | NM_007824 | CGAAGGCATTTGGACACAGA | TCCGTGGTATTTCCATCACTTG |
| FABP5 | NM_010634 | AACTGAGACGGTCTGCACCTTC | CACTCCACGATCATCTTCCCAT |
| TNF-α | NM_013693 | TGTAGCCCACGTCGTAGCAAA | GCTGGCACCACTAGTTGGTTGT |
| MCP-1 | NM_011333 | TCTCTCTTCCTCCACCACCATG | GCGTTAACTGCATCTGGCTGA |
| IL-6 | NM_031168 | GGATACCACTCCCAACAGACCT | GCCATTGCACAACTCTTTTCTC |
| CD68 | NM_009853 | TGCGGCTCCCTGTGTGT | TCTTCCTCTGTTCCTTGGGCTAT |
| F4/80 | NM_010130 | CCAGCACATCCAGCCAAAG | ACATCAGTGTTCCAGGAGACACA |
| β-Actin | NM_007393 | CTTTTCCAGCCTTCCTTCTTGG | CAGCACTGTGTTGGCATAGAGG |
NCBI, national center for biotechnology information; SCD1, stearoyl-coenzyme A desaturase 1; SREBF1, sterol regulatory element binding transcription factor 1.
2.7. Concentrations of inflammatory factors in the liver and GAT
About 30 mg of tissue was homogenized in 1× phosphate-buffered saline containing proteinase inhibitors. After centrifugation at 2000 × g at 4°C for 25 minutes, the upper lipid layer was removed and the clear supernatant was transferred into a new tube. Tumor necrosis factor α, IL-6, and MCP-1 concentrations were measured using DueSet enzyme-linked immunosorbent assay kits (R&D Systems). The delipidated tissue pellets were digested using 1 N NaOH, and total protein was measured using a bicinchoninic acid kit (Pierce Ins). Concentrations of tissue inflammatory factors were expressed as nanograms per milligram of protein.
2.8. Statistical analyses
SPSS software (version 18.0; SPSS Inc, Chicago, IL, USA) was used for all statistical analyses. Bivariate relationships were determined using the Pearson correlations. Independent Student t test was performed to compare the 2 group’s means. Differences were considered significant at P < .05. Untransformed data are presented in text, figures, and tables as means ± SEM.
3. Results
3.1. Body weight and food intake
Mice fed the control diet had slightly lower body weight than did mice fed the atherogenic diet; but differences were small and did not reach statistical significance (Fig. 1A). Mice fed the control diet had significantly higher daily food intakes compared with mice fed the atherogenic diet (Fig. 1B). Although the control diet had lower energy density than the atherogenic diet, the average energy intake was 23.89 ± 0.81 and 17.78 ± 0.77 kcal/d in mice fed the control and atherogenic diets, respectively.
Fig. 1.
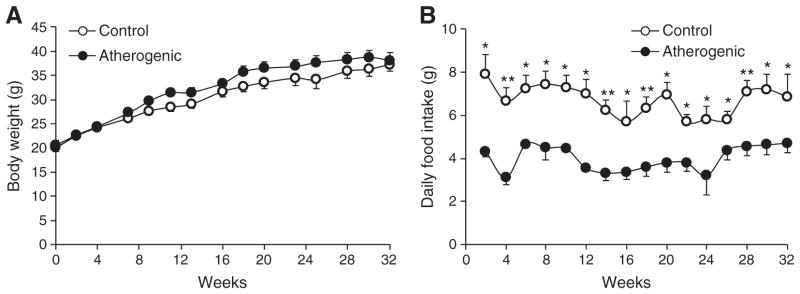
Body weight (A) and daily food intake (B) of LDLr−/− mice during the 32-week feeding period. Data are presented as means ± SEM. Independent Student t test was conducted to compare the mean body weight or daily food intake between the control and atherogenic groups. *P < .05; **P < .01.
3.2. Liver and GAT lipid content
Relative to the control diet, the atherogenic diet promoted hepatic lipid accumulation. Specifically, hepatic TC, EC, and triglyceride content were 4-fold higher in the atherogenic compared with the control diet group (Table 2). These changes were consistent with the hepatic histologic data. The livers in the atherogenic diet group had a mean steatosis score of 2.2 ± 0.4, which was 3-fold higher than the score of the livers in the control diet group (0.7 ± 0.2, P < .05; Fig. 2A). Histologic sections confirmed the absence of steatosis in the livers isolated from the mice fed the control diet and the presence of moderate steatosis in the livers isolated from mice fed the atherogenic diet (Fig. 2B and C). Gonadal adipose tissue triglyceride and TC content was higher in mice fed the atherogenic diet compared with the control diet, although only the difference in triglyceride content was statistically significant (Table 2).
Table 2.
Liver and GAT lipid content a
| Lipids (mg/mg protein) | Control | Atherogenic |
|---|---|---|
| Liver | ||
| TG | 0.5 ± 0.1 | 1.6 ± 0.2 *** |
| TC | 0.10 ± 0.02 | 0.40 ± 0.03 *** |
| FC | 0.03 ± 0.01 | 0.06 ± 0.01 ** |
| EC | 0.06 ± 0.01 | 0.35 ± 0.03 *** |
| GAT | ||
| TG | 576.34 ± 40.40 | 1584.44 ± 157.03 *** |
| TC | 5.26 ± 2.74 | 7.13 ± 2.03 |
Values are means ± SEM of untransformed data. Independent Student t test was conducted to compare the mean tissue lipid content between the control and atherogenic groups.
P < .01.
P < .001.
Fig. 2.
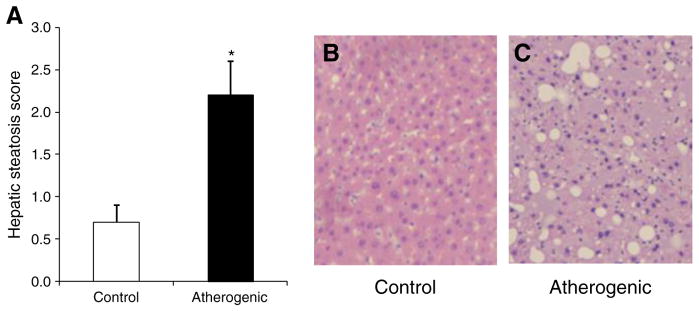
Hepatic steatosis scores and images. Hepatic steatosis score (A), representative histologic image of normal liver without steatosis (B) in the control diet group, and image of moderate steatosis (C) in the atherogenic diet group. B and C (hematoxylin and eosin, ×10 objective), taken from representative sections of the liver isolated from the control and atherogenic groups. Data are presented as means ± SEM. *P < .05.
3.3. Gene expression and protein concentrations in the liver and GAT
3.3.1. Scavenger receptors and lipid metabolism genes
In GAT but not the liver, the atherogenic diet compared with the control diet resulted in more than a 3-fold higher ABCA1, CD36, and SR-B1 mRNA expression (all P < .05; Fig. 3). Likewise, the atherogenic diet also significantly increased mRNA expression of ACSL5 and decreased mRNA expression of CYP7α1 in GAT but not liver (Fig. 4). The atherogenic diet did not change the mRNA expression of ACACA, FABP5, FASN, HMGCR, and SERBF1 in both the liver and GAT.
Fig. 3.
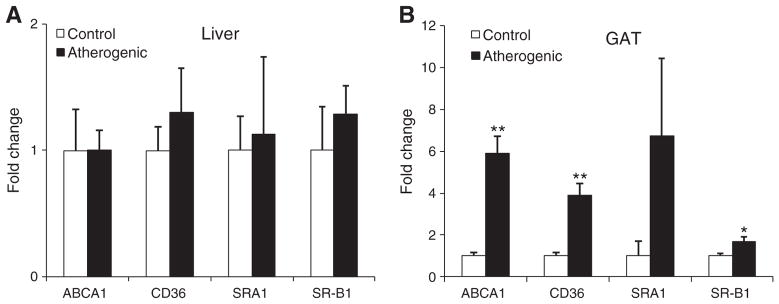
The mRNA levels of scavenger receptors in the liver (A) and GAT (B) isolated from LDLr−/− mice at the end of the 32-week feeding period. Data are presented as means ± SEM. Independent Student t test was conducted to compare the mean mRNA levels of each scavenger receptor between the control and atherogenic groups. *P < .05; **P < .01.
Fig. 4.

The mRNA levels of lipid metabolism genes in the liver (A) and GAT (B) isolated from LDLr−/− mice at the end of the 32-week feeding period. Data are presented as means ± SEM. Independent Student t test was conducted to compare the mean mRNA levels of each scavenger receptor between the control and atherogenic groups. **P < .01.
3.3.2. Inflammatory factors
Although mRNA expression of IL-6, MCP-1, TNF-α, and macrophage biomarkers (CD68 and F4/80) was higher in livers from mice fed the atherogenic diet compared with the control diet, the differences were not significant (Fig. 5A). Hepatic TNF-α protein concentrations were 2-fold higher in livers isolated from mice fed the atherogenic diet compared with the control diet (Fig. 5B). Although the atherogenic diet fed mice had significantly higher GAT IL-6 and MCP-1 mRNA expression (Fig. 5C) compared with control diet fed mice, there was no significant difference in GAT protein content of these inflammatory factors between the 2 groups (Fig. 5D).
Fig. 5.

The mRNA (A) and protein levels (B) of inflammatory factors in the liver; the mRNA (C) and protein levels (D) of inflammatory factors in GAT. Data are presented as means ± SEM. Independent Student t test was conducted to compare the mean inflammatory factor concentrations between the control and atherogenic groups. *P < .05.
3.4. Relationship between aortic TC accumulation and concentrations of lipid and inflammatory factors in blood and tissues
Aortic TC content was significantly, positively correlated with serum TC and non–HDL-C concentrations, hepatic TC and triglyceride content, GAT triglyceride content, and plasma IL-6 and MCP-1 concentrations (Table 3). Plasma IL-6 concentrations were positively correlated with aortic TC content in GAT (r = 0.613, P = .059). Plasma MCP-1 and TNF-α concentrations were not correlated with their concentrations in the liver or GAT.
Table 3.
Correlations between aortic TC content and levels of lipid and inflammatory factors in tissues a
| Aortic TC content (μg/mg of protein)
|
||
|---|---|---|
| Pearson correlation | P value (2-tailed) | |
| Serum lipid concentrations (mg/dL) | ||
| TG | −0.074 | .794 |
| TC | 0.801 | <.001 |
| Non–HDL-C | 0.816 | <.001 |
| Liver lipid content (mg/mg protein) | ||
| TG | 0.900 | <.001 |
| TC | 0.962 | <.001 |
| GAT lipid content (mg/mg protein) | ||
| TG | 0.972 | <.001 |
| TC | 0.362 | .247 |
| Plasma inflammatory factors concentrations (pg/mL) | ||
| IL-6 | 0.620 | .018 |
| MCP-1 | 0.644 | .010 |
| TNF-α | 0.220 | .471 |
Bivariate relationships were determined using the Pearson correlations.
3.5. Fatty acid composition of liver and GAT lipids
The proportion of total saturated fatty acids (SFAs) and monounsaturated fatty acids (MUFAs) was similar in the liver and GAT between the 2 diet groups. Gonadal adipose tissue had higher levels of MUFA and lower levels of polyunsaturated fatty acids (PUFAs) than the liver (Tables 4 and 5). Oleic acid was the most abundant MUFA in both the liver and GAT, accounting for more than 68% of MUFA. The liver and GAT isolated from the atherogenic diet group had lower molar percentage of total n-6 PUFA and higher molar percentage of total n-3 PUFA (Tables 4 and 5). Linoleic acid was the most abundant n-6 PUFA in both the liver and GAT, accounting for more than 50% of n-6 PUFA. α-Linolenic acid was the most abundant n-3 PUFA in GAT, accounting for more than 50% of n-3 PUFA. Docosahexaenoic acid was the most abundant n-3 PUFA in the liver, accounting for more than 69% of n-3 PUFA.
Table 4.
Fatty acids profile in livers a
| Fatty acid (mol%) | Diet
|
|
|---|---|---|
| Control | Atherogenic | |
| SFAs | 35.04 ± 1.62 | 34.86 ± 2.37 |
| 10:0 | 0.39 ± 0.20 | 0.04 ± 0.01 |
| 12:0 | 0.08 ± 0.02 | 0.11 ± 0.02 |
| 14:0 | 1.14 ± 0.17 | 1.55 ± 0.17 |
| 16:0 | 26.74 ± 0.89 | 26.64 ± 1.05 |
| 18:0 | 6.46 ± 0.68 | 6.22 ± 1.25 |
| 20:0 | 0.12 ± 0.01 | 0.19 ± 0.02 |
| 22:0 | 0.07 ± 0.01 | 0.06 ± 0.01 |
| 24:0 | 0.03 ± 0.01 | 0.06 ± 0.02 |
| MUFAs | 45.91 ± 2.82 | 48.96 ± 3.66 |
| 14:1 n-5 | 0.23 ± 0.06 | 0.21 ± 0.06 |
| 16:1 n-7 | 5.97 ± 0.45 | 4.93 ± 0.51 |
| 18:1 n-9 | 33.85 ± 2.58 | 38.40 ± 3.00 |
| 18:1 n-7 | 4.73 ± 0.30 | 3.80 ± 0.19 |
| 20:1 n-9 | 0.71 ± 0.11 | 0.77 ± 0.06 |
| 22:1n-9 | 0.02 ± 0.01 | 0.07 ± 0.01 ** |
| 24:1n-9 | 0.05 ± 0.01 | 0.11 ± 0.04 |
| PUFAs | 19.05 ± 1.86 | 16.18 ± 1.73 |
| n-6 PUFA | 16.27 ± 1.40 | 11.01 ± 1.05 ** |
| 18:2 | 8.12 ± 0.60 | 6.55 ± 0.34 * |
| 18:3 | 0.20 ± 0.03 | 0.11 ± 0.01 ** |
| 20:2 | 0.48 ± 0.02 | 0.39 ± 0.05 |
| 20:3 | 0.52 ± 0.05 | 0.58 ± 0.06 |
| 20:4 | 6.26 ± 0.83 | 3.20 ± 0.64 |
| 22:4 | 0.24 ± 0.03 | 0.11 ± 0.02 ** |
| 22:5 | 0.41 ± 0.06 | 0.07 ± 0.01 *** |
| n-3 PUFA | 2.78 ± 0.49 | 5.18 ± 0.79 * |
| 18:3 | 0.04 ± 0.01 | 0.17 ± 0.02 *** |
| 20:5 | 0.07 ± 0.01 | 0.36 ± 0.05 *** |
| 22:5 | 0.47 ± 0.15 | 1.02 ± 0.31 * |
| 22:6 | 2.20 ± 0.36 | 3.62 ± 0.57 |
Values are means ± SEM of untransformed data. Independent Student t test was conducted to compare mol% of each fatty acid between the control and atherogenic groups.
P < .05.
P < .01.
P < .001.
Table 5.
Fatty acids profile in GAT a
| Fatty acid (mol%) | Diet
|
|
|---|---|---|
| Control | Atherogenic | |
| SFAs | 28.11 ± 0.96 | 30.12 ± 0.47 |
| 10:0 | 0.07 ± 0.02 | 0.14 ± 0.03 |
| 12:0 | 0.45 ± 0.02 | 1.20 ± 0.10 *** |
| 14:0 | 3.22 ± 0.17 | 6.52 ± 0.13 *** |
| 16:0 | 22.31 ± 0.68 | 20.08 ± 0.27 * |
| 18:0 | 1.93 ± 0.47 | 1.86 ± 0.09 |
| 20:0 | 0.08 ± 0.01 | 0.05 ± 0.00 * |
| 22:0 | 0.06 ± 0.05 | 0.28 ± 0.27 |
| MUFAs | 62.06 ± 0.90 | 64.08 ± 0.40 |
| 14:1 n-5 | 0.45 ± 0.03 | 0.90 ± 0.03 *** |
| 16:1 n-7 | 13.23 ± 0.57 | 12.04 ± 0.66 |
| 18:1 n-9 | 42.57 ± 0.48 | 46.51 ± 0.48 ** |
| 18:1 n-7 | 4.58 ± 0.24 | 3.37 ± 0.05 ** |
| 20:1 n-9 | 0.79 ± 0.05 | 0.40 ± 0.03 *** |
| 22:1 n-9 | 0.05 ± 0.01 | 0.03 ± 0.00 |
| PUFAs | 9.83 ± 0.38 | 5.81 ± 0.10 *** |
| n-6 PUFA | 9.61 ± 0.37 | 5.28 ± 0.08 *** |
| 18:2 | 8.60 ± 0.31 | 4.97 ± 0.08 *** |
| 18:3 | 0.05 ± 0.01 | 0.07 ± 0.01 * |
| 20:2 | 0.23 ± 0.01 | 0.06 ± 0.00 *** |
| 20:3 | 0.13 ± 0.03 | 0.07 ± 0.01 |
| 20:4 | 0.44 ± 0.23 | 0.10 ± 0.00 |
| n-3 PUFA | 0.22 ± 0.02 | 0.53 ± 0.02 *** |
| 18:3 | 0.11 ± 0.01 | 0.32 ± 0.01 *** |
| 20:5 | 0.04 ± 0.01 | 0.09 ± 0.01 ** |
| 22:5 | 0.01 ± 0.00 | 0.06 ± 0.00 *** |
| 22:6 | 0.05 ± 0.03 | 0.06 ± 0.0 |
Values are means ± SEM of untransformed data. Independent Student t test was conducted to compare mol% of each fatty acid between the control and atherogenic groups.
P < .05.
P < .01.
P < .001.
4. Discussion
This study is an extension of previously published research [23] in which we demonstrated that the atherogenic diet when compared with the control diet resulted in higher plasma inflammatory factor concentrations, increased serum non–HDL-C (1011.9 ± 46.7 mg/dL vs 541.6 ± 45.6 mg/dL) and ratio of TC to HDL-C (20.8 ± 1.8 vs 13.1 ± 1.0), slightly increased serum TG (230.4 mg/dL ± 38.4 vs 186.1 ± 24.6 mg/dL) concentrations, and increased macrophage deposition in the aortic wall and had greater aortic TC accumulation (408.3 ± 34.3 vs 74.9 ± 7.9). Body weight gain was similar between the 2 diet groups, which resulted from significant difference in food intake. In the present study, we focused on changes in the liver and visceral adipose tissue because they are the major organs in regulating blood lipid profiles and systemic inflammation. In addition, their relationship to atherosclerotic lesion development is not completely understood. Consistent with prior reports [31,32], we documented that the atherogenic diet dramatically increased hepatic triglyceride and cholesterol content as well as GAT triglyceride content, which correlated with aortic TC content. We further demonstrated that systemic inflammation but not hepatic or GAT inflammation was directly correlated with atherosclerotic TC accumulation.
Liver fat, especially in the obese state, is positively correlated with visceral adipose tissue mass [33]. The “portal hypothesis” suggests that increased lipolysis in enlarged visceral adipose tissue elevates circulating free fatty acid concentrations and increases the flux of free fatty acids into the liver, resulting in increased hepatic fat content [34]. The atherogenic diet induced the development of hepatic steatosis, which has been shown to be associated with increased risk of cardiovascular disease and atherogenic lipid profile [35]. Hepatic steatosis has also been shown to be significantly associated with marked carotid atherosclerosis [36]. In the current study, hepatic TC and triglyceride content positively correlated with aortic TC content in LDLr−/− mice. In addition, diet-induced hepatic steatosis was positively correlated with atherosclerotic lesion formation. It has been suggested that hepatic steatosis is associated with atherosclerotic lesion development via the following possible mechanisms: endothelial dysfunction, dyslipidemia, inflammation and oxidative stress, and postprandial hyperlipidemia [35]. In this study, mice fed with the atherogenic diet had about a 4-fold higher hepatic TC and triglyceride content and a 3-fold higher GAT triglyceride content than did mice in the control group. The magnitude of increased triglyceride content in our study was similar in the liver and GAT, which is consistent with the portal hypothesis.
The fatty acid composition of liver and GAT lipids in mice for SFA and MUFA was similar among the 2 groups, and the liver lipid PUFA composition was similar among the 2 diet groups. The control diet showed a 1.8-fold higher mol% of total PUFA than the atherogenic diet in GAT. Because the mice fed the atherogenic diet had higher TG content in both liver and GAT by 3-fold, the absolute amounts of SFA, MUFA, and PUFA were higher in the liver and GAT from mice fed the atherogenic diet compared with the control diet.
To further understand the mechanism(s) that may be responsible for increased lipid content in the liver and GAT, we assessed mRNA expression of scavenger receptors and critical genes involved in lipid metabolism. For the first time, we demonstrated that an atherogenic diet significantly increased the expression of ABCA1, CD36, and SR-B1 in GAT. CD36 is highly expressed in adipose tissues, myocardial and skeletal muscle, and macrophages, and it has been shown to facilitate modified LDL and fatty acid uptake by those tissues [37], as well as induce adipocyte differentiation and adipogenesis [38]. In the current study, the increased expression of GAT CD36 induced by the atherogenic diet might be a compensatory mechanism to allow adipocytes to take up more systemic fatty acids and transform them into triglycerides for storage.
SR-B1 mediates the selective efflux of cellular cholesterol to HDL, and ABCA1 promotes FC and phospholipid efflux from cells to HDL [39]. Adipose tissue is a major site of cholesterol storage. ABCA1 and SR-B1 play an important role in cholesterol homeostasis in adipose tissue and HDL biogenesis and modulation [39,40]. We demonstrated that the atherogenic diet increased the expression of ABCA1 and SR-B1 in GAT, which might partially contribute to the slightly increased serum HDL-C concentrations reported in our previous publication [27], and similar GAT cholesterol content in control and atherogenic diet groups. Given these data, the finding that the expression of CD36, ABCA1, and SR-B1 in GAT is increased by the atherogenic diet may provide useful information to help understand the mechanism mediating the effect of dietary lipid on atherosclerotic lesion formation.
CYP7α1 is a key enzyme for bile acid synthesis. The most important regulator for CYP7α1 expression is cellular cholesterol levels. Increased cellular cholesterol accumulation can result in the higher expression of CYP7α1 [41]. Higher hepatic cholesterol content in the atherogenic diet group may partially contribute to the 2-fold higher expression of CYP7α1 in the liver. The role of CYP7α1 in visceral adipose tissue is unknown. More studies are required to investigate the function and regulation of CYP7α1 in visceral adipose tissue.
ACSL5 belongs to the long-chain fatty acyl-CoA synthetase family. It can convert long-chain fatty acids to fatty acyl-CoA, which can be used for β-oxidation of fatty acids or be incorporated into triglycerides, EC, and phospholipids in the liver and adipose tissues [42,43]. Few studies have investigated the role of ASCL5 in visceral adipose tissues. The atherogenic diet increased the flux of fatty acids into GAT, which may stimulate the expression of ACSL5, thus resulting in greater triglyceride formation and storage in GAT. Overall, in response to increased blood triglyceride and non–HDL-C concentrations induced by the atherogenic diet, some key genes involved in fatty acid uptake and triglyceride formation were up-regulated in GAT.
Given the preponderance of evidence from clinical and experimental studies that suggest that inflammation plays a major role in the pathophysiology of atherosclerotic lesion formation [13], we tested whether adipose and hepatic inflammation correlated with systemic inflammation and formation of atherosclerotic lesions. Epidemiologic studies have shown a positive association between the Western-type diet and plasma concentrations of MCP-1, IL-6, and TNF-α [44–46]. Furthermore, our previous study demonstrated that the atherogenic diet when compared with the control diet, resulted in significantly higher systemic concentrations of MCP-1, IL-6, and TNF-α in LDLr−/− mice [23]. Expanded visceral adipose tissue and fatty liver, because it occurs in obesity, recruit more immune cells, especially macrophages, and produce more inflammatory factors [6,47].
We rejected part of our hypothesis because we found that only systemic inflammation, not hepatic or GAT inflammation, was directly correlated with atherosclerotic TC accumulation. A high-fat diet was previously shown to increase hepatic TNF-α content [48]. In the current study, TNF-α was 2-fold higher in the livers isolated from mice fed the atherogenic diet relative to the control diet. The expression of CD68 and F4/80, the phenotype markers for macrophages, was more than 2-fold higher in the livers isolated from mice fed the atherogenic diet relative to the control diet. These data indicate that increased macrophage infiltration into liver may represent a major contributor to the elevated TNF-α production in the liver induced by the atherogenic diet. It is currently not known whether, or to what extent, the elevated plasma TNF-α could be attributed to the liver source. Although the primary source of TNF-α is macrophages, it can also be produced by hepatocytes, endothelial cells, adipocytes, and T cells [49–51]. The atherogenic diet significantly increased the mRNA levels of MCP-1 in GAT, but MCP-1 protein levels were similar between the 2 diet groups, which may be caused by posttranscriptional modification. The atherogenic diet dramatically increased IL-6 and MCP-1 concentrations in plasma but not in the liver and GAT, thus suggesting that the liver and GAT are not major contributors to blood IL-6 and MCP-1. Vascular cells and blood cells, including activated endothelial cells, monocytes, and dendritic cells, can produce IL-6 and MCP-1, and they may contribute to increased systemic inflammatory response and atherosclerotic lesion development, although the involvement of the other organs/tissues cannot be ruled out.
Some limitations are present in this study. First, this is a long-term feeding study; the effect of short-term feeding on atherosclerotic cholesterol content, tissue lipid content, and inflammation need to be investigated in a separate study. Second, we measured serum lipid profile and plasma concentrations of TNF-α, IL-6, and MCP-1, which were previously published to address a different experimental question [23]. Owing to the limited amount of blood collected from each mouse, we could not measure blood free fatty acids, glucose and insulin concentrations, liver function parameters, and liver injury biomarkers such as blood albumin, bilirubin, aspartate, and aminotransferase/alanine aminotransferase. Third, although GAT is not the major adipose tissue in humans, GAT is the major visceral adipose tissue in rodents. Owing to its abundance, easy collection, and no lymph contamination, GAT has been widely used in rodent obesity and inflammation studies [52]. Finally, we perfused mouse hearts with saline for 1 minute before we collected aortas, livers and GAT. The perfusion could result in inaccurate liver and GAT weight. Therefore, we only reported lipid content in the liver and GAT with a unit of milligrams per milligram of tissue protein.
In conclusion, our results suggest that systemic inflammation but not hepatic and GAT inflammatory status positively correlated with atherosclerotic lesion formation. In addition, the atherogenic diet, compared with the control diet, increased lipid accumulation in the liver and GAT, which was significantly associated with more atherosclerotic lesion formation in LDLr−/− mice.
Acknowledgments
The authors would like to thank Amy Wu for helping with the lipid extraction from the liver and GAT and Priyanka Bapat, Ming Sun, and Jia Zhang for helping with the data management and part of the statistical analysis.
Abbreviations
- ABCA1
ATP-binding cassette, subfamily A, member 1
- ACACA
acetyl-coenzyme A carboxylase α
- ACSL5
acyl-CoA synthetase long-chain family member 5
- CYP7α1
cytochrome P450, family 7, subfamily a, polypeptide 1
- EC
esterified cholesterol
- FABP5
fatty acid–binding protein 5
- FASN
fatty acid synthase
- FC
free cholesterol
- GAT
gonadal adipose tissue
- HDL-C
high-density lipoprotein cholesterol
- HMGCR
3-hydroxy-3-methylglutaryl-coenzyme A reductase
- IL-6
interleukin 6
- LDL-C
low-density lipoprotein cholesterol
- LDLr−/−
low-density lipoprotein receptor null
- MCP-1
monocyte chemoattractant protein 1
- MUFA
monounsaturated fatty acids
- PUFA
polyunsaturated fatty acids
- SFA
saturated fatty acids
- SR-B1
scavenger receptor class B, member 1
- TC
Total cholesterol
- TG
triglyceride
- TNF-α
tumor necrosis factor α
Footnotes
The authors had no conflict of interest to report.
References
- 1.Quillard T, Libby P. Molecular imaging of atherosclerosis for improving diagnostic and therapeutic development. Circ Res. 2012;111(2):231–44. doi: 10.1161/CIRCRESAHA.112.268144. [DOI] [PMC free article] [PubMed] [Google Scholar]
- 2.Sacks FM. Dietary fat, the Mediterranean diet, and health: reports from scientific exchanges, 1998 and 2000. Introduction. Am J Med. 2002;113(Suppl 9B 113):1S–4S. doi: 10.1016/s0002-9343(01)00985-8. [DOI] [PubMed] [Google Scholar]
- 3.Katan MB, Brouwer IA, Clarke R, Geleijnse JM, Mensink RP. Saturated fat and heart disease. Am J Clin Nutr. 2010;92(2):459–460. doi: 10.3945/ajcn.2010.29752. author reply 460–451. [DOI] [PMC free article] [PubMed] [Google Scholar]
- 4.Fernandez ML. Rethinking dietary cholesterol. Curr Opin Clin Nutr Metab Care. 2012;15(2):117–21. doi: 10.1097/MCO.0b013e32834d2259. [DOI] [PubMed] [Google Scholar]
- 5.Hu FB, Manson JE, Willett WC. Types of dietary fat and risk of coronary heart disease: a critical review. J Am Coll Nutr. 2001;20(1):5–19. doi: 10.1080/07315724.2001.10719008. [DOI] [PubMed] [Google Scholar]
- 6.Item F, Konrad D. Visceral fat and metabolic inflammation: the portal theory revisited. Obes Rev. 2012;13(Suppl 2 ):30–9. doi: 10.1111/j.1467-789X.2012.01035.x. [DOI] [PubMed] [Google Scholar]
- 7.Bhatia LS, Curzen NP, Calder PC, Byrne CD. Non-alcoholic fatty liver disease: a new and important cardiovascular risk factor? Eur Heart J. 2012;33(10):1190–200. doi: 10.1093/eurheartj/ehr453. [DOI] [PubMed] [Google Scholar]
- 8.Stefan N, Kantartzis K, Machann J, Schick F, Thamer C, Rittig K, et al. Identification and characterization of metabolically benign obesity in humans. Arch Intern Med. 2008;168(15):1609–16. doi: 10.1001/archinte.168.15.1609. [DOI] [PubMed] [Google Scholar]
- 9.Kishida K, Funahashi T, Matsuzawa Y, Shimomura I. Visceral adiposity as a target for the management of the metabolic syndrome. Ann Med. 2012;44(3):233–41. doi: 10.3109/07853890.2011.564202. [DOI] [PubMed] [Google Scholar]
- 10.Tuyama AC, Chang CY. Non-alcoholic fatty liver disease. J Diabetes. 2012;4(3):266–80. doi: 10.1111/j.1753-0407.2012.00204.x. [DOI] [PubMed] [Google Scholar]
- 11.Rasouli N, Kern PA. Adipocytokines and the metabolic complications of obesity. J Clin Endocrinol Metab. 2008;93(11 Suppl 1):S64–73. doi: 10.1210/jc.2008-1613. [DOI] [PMC free article] [PubMed] [Google Scholar]
- 12.Libby P. Inflammation in atherosclerosis. Nature. 2002;420(6917):868–74. doi: 10.1038/nature01323. [DOI] [PubMed] [Google Scholar]
- 13.Willerson JT, Ridker PM. Inflammation as a cardiovascular risk factor. Circulation. 2004;109(21 Suppl 1):II2–II10. doi: 10.1161/01.CIR.0000129535.04194.38. [DOI] [PubMed] [Google Scholar]
- 14.Libby P, Theroux P. Pathophysiology of coronary artery disease. Circulation. 2005;111(25):3481–8. doi: 10.1161/CIRCULATIONAHA.105.537878. [DOI] [PubMed] [Google Scholar]
- 15.Kalupahana NS, Claycombe KJ, Moustaid-Moussa N. (n-3) Fatty acids alleviate adipose tissue inflammation and insulin resistance: mechanistic insights. Adv Nutr. 2011;2(4):304–16. doi: 10.3945/an.111.000505. [DOI] [PMC free article] [PubMed] [Google Scholar]
- 16.Fiotti N, Giansante C, Ponte E, Delbello C, Calabrese S, Zacchi T, et al. Atherosclerosis and inflammation. Patterns of cytokine regulation in patients with peripheral arterial disease. Atherosclerosis. 1999;145(1):51–60. doi: 10.1016/s0021-9150(99)00013-1. [DOI] [PubMed] [Google Scholar]
- 17.Brueckmann M, Bertsch T, Lang S, Sueselbeck T, Wolpert C, Kaden JJ, et al. Time course of systemic markers of inflammation in patients presenting with acute coronary syndromes. Clin Chem Lab Med. 2004;42(10):1132–9. doi: 10.1515/CCLM.2004.232. [DOI] [PubMed] [Google Scholar]
- 18.Song L, Schindler C. IL-6 and the acute phase response in murine atherosclerosis. Atherosclerosis. 2004;177(1):43–51. doi: 10.1016/j.atherosclerosis.2004.06.018. [DOI] [PubMed] [Google Scholar]
- 19.Kinlay S, Egido J. Inflammatory biomarkers in stable atherosclerosis. Am J Cardiol. 2006;98(11A):2P–8P. doi: 10.1016/j.amjcard.2006.09.014. [DOI] [PubMed] [Google Scholar]
- 20.Rosenson RS, Tangney CC, Levine DM, Parker TS, Gordon B. Elevated soluble tumor necrosis factor receptor levels in non-obese adults with the atherogenic dyslipoproteinemia. Atherosclerosis. 2004;177(1):77–81. doi: 10.1016/j.atherosclerosis.2004.05.027. [DOI] [PubMed] [Google Scholar]
- 21.Haddy N, Sass C, Droesch S, Zaiou M, Siest G, Ponthieux A, et al. IL-6, TNF-alpha and atherosclerosis risk indicators in a healthy family population: the STANISLAS cohort. Atherosclerosis. 2003;170(2):277–83. doi: 10.1016/s0021-9150(03)00287-9. [DOI] [PubMed] [Google Scholar]
- 22.Oh DY, Morinaga H, Talukdar S, Bae EJ, Olefsky JM. Increased macrophage migration into adipose tissue in obese mice. Diabetes. 2012;61(2):346–54. doi: 10.2337/db11-0860. [DOI] [PMC free article] [PubMed] [Google Scholar]
- 23.Wang S, Wu D, Matthan NR, Lamon-Fava S, Lecker JL, Lichtenstein AH. Enhanced aortic macrophage lipid accumulation and inflammatory response in LDL receptor null mice fed an atherogenic diet. Lipids. 2010;45(8):701–11. doi: 10.1007/s11745-010-3454-8. [DOI] [PMC free article] [PubMed] [Google Scholar]
- 24.Wierzbicki AS, Oben J. Nonalcoholic fatty liver disease and lipids. Curr Opin Lipidol. 2012;23(4):345–52. doi: 10.1097/MOL.0b013e3283541cfc. [DOI] [PubMed] [Google Scholar]
- 25.Kalupahana NS, Voy BH, Saxton AM, Moustaid-Moussa N. Energy-restricted high-fat diets only partially improve markers of systemic and adipose tissue inflammation. Obesity (Silver Spring) 2011;19(2):245–54. doi: 10.1038/oby.2010.196. [DOI] [PubMed] [Google Scholar]
- 26.Napoli C, Williams-Ignarro S, De Nigris F, Lerman LO, Rossi L, Guarino C, et al. Long-term combined beneficial effects of physical training and metabolic treatment on atherosclerosis in hypercholesterolemic mice. Proc Natl Acad Sci U S A. 2004;101(23):8797–802. doi: 10.1073/pnas.0402734101. [DOI] [PMC free article] [PubMed] [Google Scholar]
- 27.Wang S, Wu D, Matthan NR, Lamon-Fava S, Lecker JL, Lichtenstein AH. Reduction in dietary omega-6 polyunsaturated fatty acids: eicosapentaenoic acid plus docosahexaenoic acid ratio minimizes atherosclerotic lesion formation and inflammatory response in the LDL receptor null mouse. Atherosclerosis. 2009;204(1):147–55. doi: 10.1016/j.atherosclerosis.2008.08.024. [DOI] [PMC free article] [PubMed] [Google Scholar]
- 28.Folch J, Lees M, Sloane Stanley GH. A simple method for the isolation and purification of total lipides from animal tissues. J Biol Chem. 1957;226(1):497–509. [PubMed] [Google Scholar]
- 29.Lichtenstein AH, Matthan NR, Jalbert SM, Resteghini NA, Schaefer EJ, Ausman LM. Novel soybean oils with different fatty acid profiles alter cardiovascular disease risk factors in moderately hyperlipidemic subjects. Am J Clin Nutr. 2006;84(3):497–504. doi: 10.1093/ajcn/84.3.497. [DOI] [PubMed] [Google Scholar]
- 30.Livak KJ, Schmittgen TD. Analysis of relative gene expression data using real-time quantitative PCR and the 2(−Delta Delta C(T)) method. Methods. 2001;25(4):402–8. doi: 10.1006/meth.2001.1262. [DOI] [PubMed] [Google Scholar]
- 31.Park HJ, Jung UJ, Lee MK, Cho SJ, Jung HK, Hong JH, et al. Modulation of lipid metabolism by polyphenol-rich grape skin extract improves liver steatosis and adiposity in high fat fed mice. Mol Nutr Food Res. 2013;57(2):360–4. doi: 10.1002/mnfr.201200447. [DOI] [PubMed] [Google Scholar]
- 32.de Wit N, Derrien M, Bosch-Vermeulen H, Oosterink E, Keshtkar S, Duval C, et al. Saturated fat stimulates obesity and hepatic steatosis and affects gut microbiota composition by an enhanced overflow of dietary fat to the distal intestine. Am J Physiol Gastrointest Liver Physiol. 2012;303(5):G589–99. doi: 10.1152/ajpgi.00488.2011. [DOI] [PubMed] [Google Scholar]
- 33.Kotronen A, Westerbacka J, Bergholm R, Pietilainen KH, Yki-Jarvinen H. Liver fat in the metabolic syndrome. J Clin Endocrinol Metab. 2007;92(9):3490–7. doi: 10.1210/jc.2007-0482. [DOI] [PubMed] [Google Scholar]
- 34.Bjorntorp P. “Portal” adipose tissue as a generator of risk factors for cardiovascular disease and diabetes. Arteriosclerosis. 1990;10(4):493–6. [PubMed] [Google Scholar]
- 35.Ahmed MH, Barakat S, Almobarak AO. Nonalcoholic fatty liver disease and cardiovascular disease: has the time come for cardiologists to be hepatologists? J Obes. 2012;2012:483135. doi: 10.1155/2012/483135. [DOI] [PMC free article] [PubMed] [Google Scholar]
- 36.Ramilli S, Pretolani S, Muscari A, Pacelli B, Arienti V. Carotid lesions in outpatients with nonalcoholic fatty liver disease. World J Gastroenterol. 2009;15(38):4770–4. doi: 10.3748/wjg.15.4770. [DOI] [PMC free article] [PubMed] [Google Scholar]
- 37.McLaren JE, Michael DR, Guschina IA, Harwood JL, Ramji DP. Eicosapentaenoic acid and docosahexaenoic acid regulate modified LDL uptake and macropinocytosis in human macrophages. Lipids. 2011;46(11):1053–61. doi: 10.1007/s11745-011-3598-1. [DOI] [PubMed] [Google Scholar]
- 38.Christiaens V, Van Hul M, Lijnen HR, Scroyen I. CD36 promotes adipocyte differentiation and adipogenesis. Biochim Biophys Acta. 2012;1820(7):949–56. doi: 10.1016/j.bbagen.2012.04.001. [DOI] [PubMed] [Google Scholar]
- 39.Baranova I, Vishnyakova T, Bocharov A, Chen Z, Remaley AT, Stonik J, et al. Lipopolysaccharide down regulates both scavenger receptor B1 and ATP binding cassette transporter A1 in RAW cells. Infect Immun. 2002;70(6):2995–3003. doi: 10.1128/IAI.70.6.2995-3003.2002. [DOI] [PMC free article] [PubMed] [Google Scholar]
- 40.Zhang Y, McGillicuddy FC, Hinkle CC, O’Neill S, Glick JM, Rothblat GH, et al. Adipocyte modulation of high-density lipoprotein cholesterol. Circulation. 2010;121(11):1347–55. doi: 10.1161/CIRCULATIONAHA.109.897330. [DOI] [PMC free article] [PubMed] [Google Scholar]
- 41.Luoma PV. Cytochrome P450 and gene activation—from pharmacology to cholesterol elimination and regression of atherosclerosis. Eur J Clin Pharmacol. 2008;64(9):841–50. doi: 10.1007/s00228-008-0515-5. [DOI] [PubMed] [Google Scholar]
- 42.Soupene E, Kuypers FA. Mammalian long-chain acyl-CoA synthetases. Exp Biol Med (Maywood) 2008;233(5):507–21. doi: 10.3181/0710-MR-287. [DOI] [PMC free article] [PubMed] [Google Scholar]
- 43.Bu SY, Mashek DG. Hepatic long-chain acyl-CoA synthetase 5 mediates fatty acid channeling between anabolic and catabolic pathways. J Lipid Res. 2010;51(11):3270–80. doi: 10.1194/jlr.M009407. [DOI] [PMC free article] [PubMed] [Google Scholar]
- 44.Pawlak K, Pawlak D, Mysliwiec M. Inflammation but not oxidative stress is associated with beta-chemokine levels and prevalence of cardiovascular disease in uraemic patients. Cytokine. 2006;35(5–6):258–62. doi: 10.1016/j.cyto.2006.09.004. [DOI] [PubMed] [Google Scholar]
- 45.Baer DJ, Judd JT, Clevidence BA, Tracy RP. Dietary fatty acids affect plasma markers of inflammation in healthy men fed controlled diets: a randomized crossover study. Am J Clin Nutr. 2004;79(6):969–73. doi: 10.1093/ajcn/79.6.969. [DOI] [PubMed] [Google Scholar]
- 46.Lopez-Garcia E, Schulze MB, Fung TT, Meigs JB, Rifai N, Manson JE, et al. Major dietary patterns are related to plasma concentrations of markers of inflammation and endothelial dysfunction. Am J Clin Nutr. 2004;80(4):1029–35. doi: 10.1093/ajcn/80.4.1029. [DOI] [PubMed] [Google Scholar]
- 47.Johnson AR, Milner JJ, Makowski L. The inflammation highway: metabolism accelerates inflammatory traffic in obesity. Immunol Rev. 2012;249(1):218–38. doi: 10.1111/j.1600-065X.2012.01151.x. [DOI] [PMC free article] [PubMed] [Google Scholar]
- 48.Kawanishi N, Yano H, Mizokami T, Takahashi M, Oyanagi E, Suzuki K. Exercise training attenuates hepatic inflammation, fibrosis and macrophage infiltration during diet induced-obesity in mice. Brain Behav Immun. 2012;26(6):931–41. doi: 10.1016/j.bbi.2012.04.006. [DOI] [PubMed] [Google Scholar]
- 49.Charo IF, Ransohoff RM. The many roles of chemokines and chemokine receptors in inflammation. N Engl J Med. 2006;354(6):610–21. doi: 10.1056/NEJMra052723. [DOI] [PubMed] [Google Scholar]
- 50.Glass CK, Witztum JL. Atherosclerosis. The road ahead. Cell. 2001;104(4):503–16. doi: 10.1016/s0092-8674(01)00238-0. [DOI] [PubMed] [Google Scholar]
- 51.Vignali DA, Collison LW, Workman CJ. How regulatory T cells work. Nat Rev Immunol. 2008;8(7):523–32. doi: 10.1038/nri2343. [DOI] [PMC free article] [PubMed] [Google Scholar]
- 52.Tran TT, Kahn CR. Transplantation of adipose tissue and stem cells: role in metabolism and disease. Nat Rev Endocrinol. 2010;6(4):195–213. doi: 10.1038/nrendo.2010.20. [DOI] [PMC free article] [PubMed] [Google Scholar]