
Fig. 1.
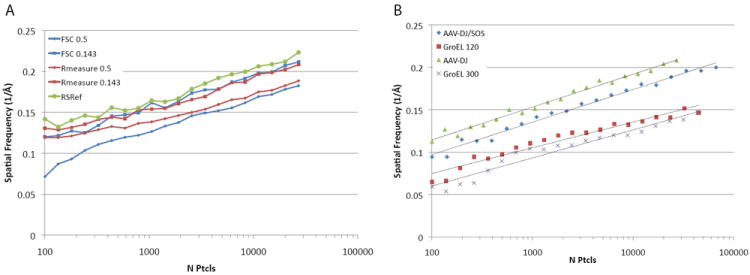
ResLog plots calculated using different resolution estimates and for different samples. A) Resolution estimated by AAV-DJ at FSC0.5 and FSC0.143 is compared against the Fourier neighbor correlation calculated by Rmeasure at 0.5 and 0.143, and using the resolution calculated by comparison against an atomic structure (RSRef). B) ResLog plots for four different samples: AAV-DJ, AAV-DJ/SOS, and GroEL all collected at 120 keV and GroEL collected at 300 keV.