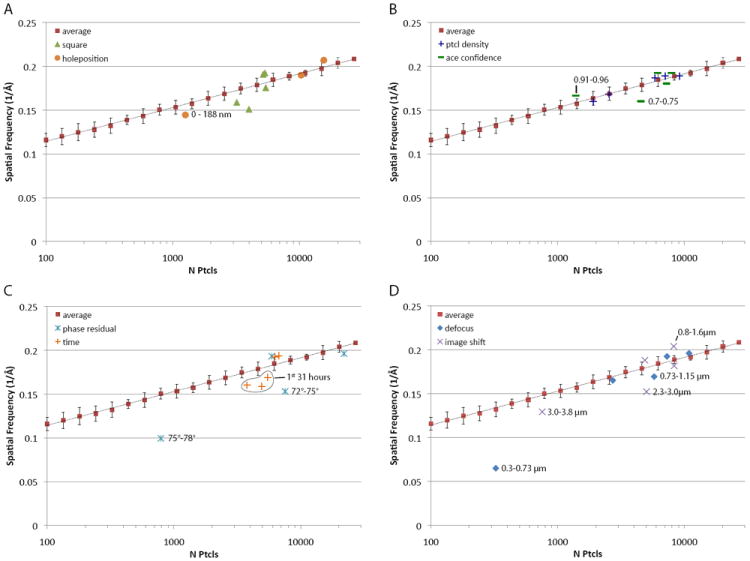
Fig. 4.

ResLog plots (FSC0.143) comparing metadata directed subsets of particles against the average of randomly selected subsets. Samples that are outside of 2 standard deviations from the mean of the randomly sampled data are highlighted with their metadata range. A) Particles sampled by the grid square from which they derived (green triangles) and particles sampled by their position with respect to the center of the hole where they were located (orange circles). B) Particles sampled by particle density in the hole where they were located (blue crosses), and particles sampled by the confidence of the CTF estimation (green dashes). C) Particles sampled by their respective phase residual in the Frealign refinement (cyan stars), particles sampled by the time of day in which they were collected (orange crosses). D) Particles sampled by their estimated defocus (blue diamonds), and particles sampled by the image shift of the microscope while they were collected (magenta xs).
