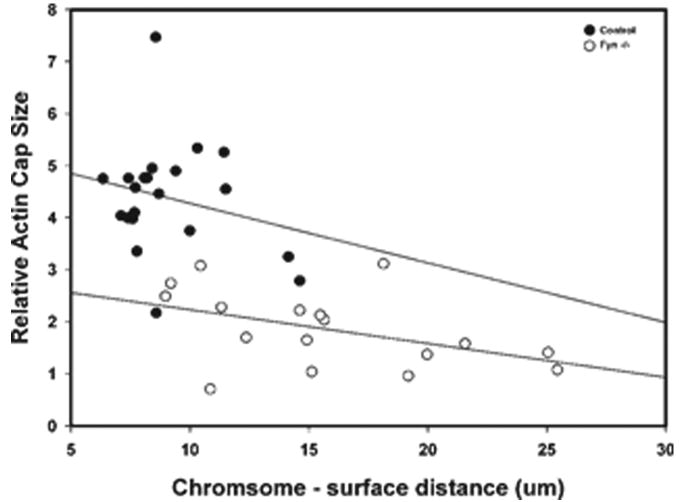
Figure 7.
Relationship between chromosome to surface distance and actin cap size. The relative actin cap size of individual control B6/129SF2/J oocytes (hollow circles) and Fyn-null oocytes (solid circles) was determined as in Figure 6 and is presented on the vertical axis. The distance of the center of the chromosomal mass from the oocyte surface is presented on the horizontal axis. Linear regression analysis was used to calculate the slope of each group of points.

