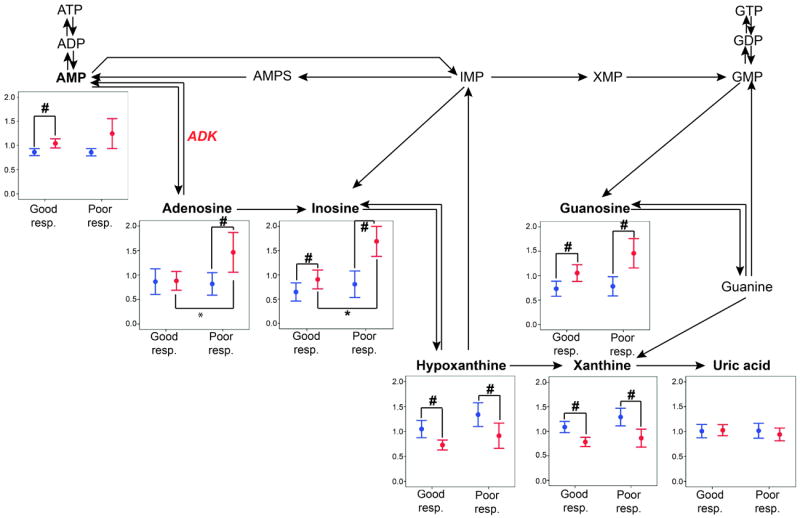
Figure 1.

Data represents standardized mean and standard error of metabolite levels before (blue) and after (red) aspirin therapy in good vs. poor responders. Metabolites in bold were measured in this study. #:p<0.05 for testing the difference in metabolite levels after vs. before aspirin. *:p<0.05 for testing the difference in metabolite levels in good vs. poor responders. Key: ATP, ADP and AMP: adenosine tri-, di- and mono-phosphate, AMPS: adenylosuccinate, IMP: inosine monophosphate, XMP: xanthosine monophosphate, GTP, GDP, GMP: guanosine tri-, di- and monophosphate, ADK: adenosine kinase.
