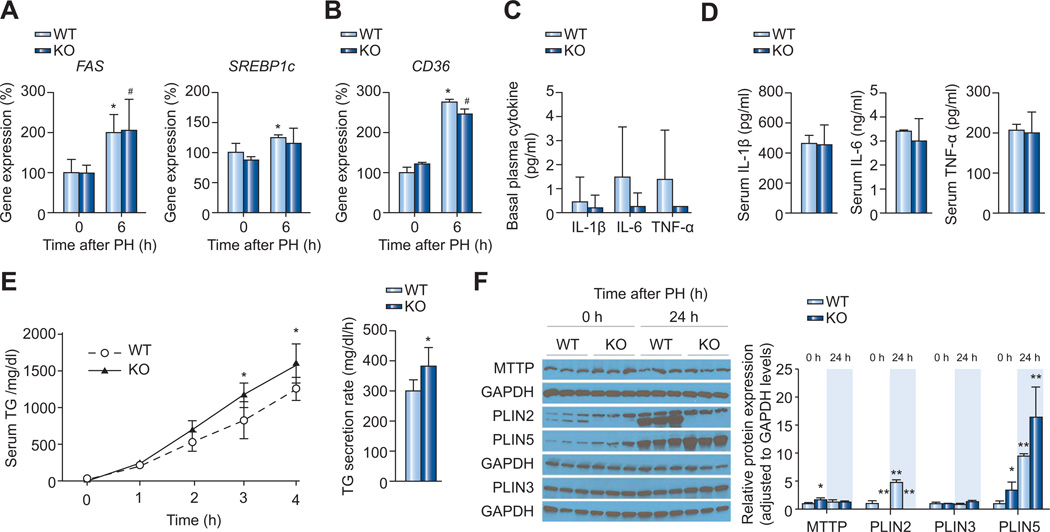
Fig. 2. Mechanisms of hepatic TG reduction in the liver of Plin2−/− compared to that of the wild-type (WT) mice after PH.
Quantitative RT-PCR analysis of mRNA expression of (A) lipogenic genes, FAS and SREBP1c, and (B) the fatty acid transporter, CD36, in wild-type and mice at indicated time after PH. (n = 4 of each group). (C) Basal plasma cytokine levels in wild-type and Plin2−/− mice. (D) Serum cytokine levels measured at 6 h after PH (n = 4–5 of each group). Plasma IL-1β, IL-6, and TNF-α were measured by using ELISA kits (n = 4). (E) VLDL secretion determined at 24 h after PH (n = 5 of each group). Plasma TG levels were determined at indicated time after i.p. injection of Pluronic F-127, a lipoprotein lipase inhibitor at 2 mg/g BW (left panel). We calculated the rate of VLDL secretion (right panel) using data obtained between 1 and 4 h when the secretion was occurring at near-linear rate. (F) Western blot analyses of MTTP and LD proteins (PLIN2, 3, and 5 are shown; PLIN4 was undetectable) before (0 h) and 24 h after PH in the wild-type and Plin2−/− mice (left panel). Three independent polyacrylamide gels were analyzed and GAPDH was used as an internal control in each case. Quantitative analyses of proteins (right panel) were done using Image J software. W, wild-type; KO, Plin2−/− mice. In all panels, data are expressed as means ± S.D. *p <0.05, **p <0.01 vs. wild-type group. (This figure appears in colour on the web.)

