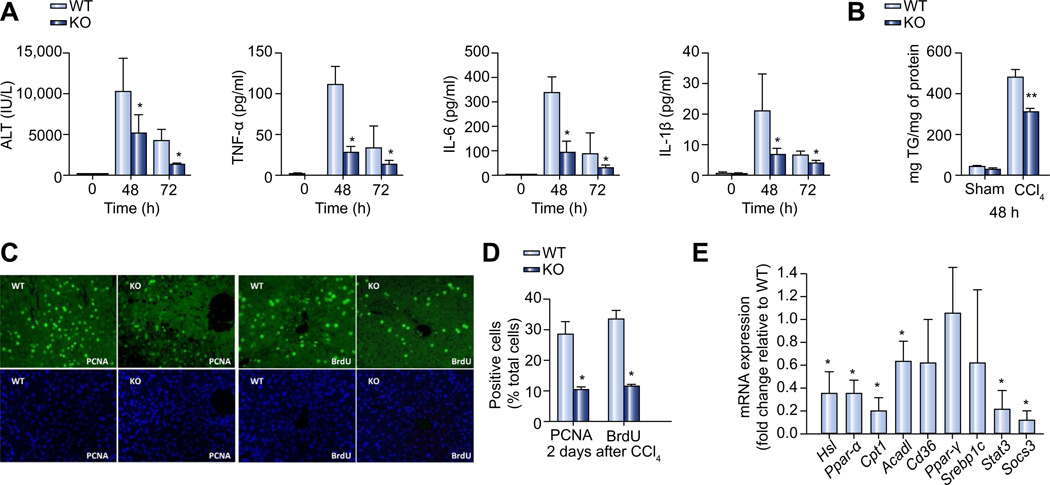
Fig. 4. Impaired liver regeneration after CCl4 treatment in Plin2−/− mice.
(A) Plasma liver enzyme (ALT) and inflammatory cytokine (TNF-α, IL-6, and IL-1β) levels before (0 h) and 48 and 72 h after CCl4 treatment in wild-type and Plin2−/− mice (n = 6). (B) Hepatic TG content in wild-type and Plin2−/− mice 48 h after CCl4 or sham treatments. (C) PCNA and BrdU staining (upper panel) of liver sections from 48 h after CCl4 treatment in wild-type and Plin2−/− mice. DAPI (lower panel) staining was used to identify nuclei and for cell counting. (D) Percent of PCNA and BrdU positive cells 2 days (48 h) after CCl4 treatment in the wild-type and Plin2−/− mice. (E) Quantitative analysis of mRNA expression 72 h after CCl4 treatment. Relative mRNA expression in Plin2−/− mice was shown by using house-keeping genes as controls and expressed as ratios to the levels of the wild-type. *p <0.05 and **p <0.01 between wild-type and Plin2−/− mice (n = 6). WT, wild-type; KO, Plin2−/−. (This figure appears in colour on the web.)

