
Figure 6. Arterial blood pressure, carotid flow and carotid resistance in response to initial NOS blockade with intravenous LNNA infusion (squares) and a repeat exposure to intravenous LNNA 2 days later (circles).
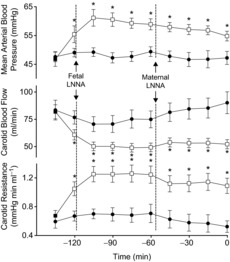
Open symbols represent time points that were significantly different from the baseline (−135 min) value (1-way ANOVA with Bonferroni post hoc analysis). The significant increases in blood pressure, decreases in carotid flow and increases in arterial resistance seen after the first exposure to LNNA were not seen with re-exposure to LNNA 2 days later. *Significant difference between 1st exposure and 2nd exposure (2-way ANOVA with Bonferroni post hoc test).