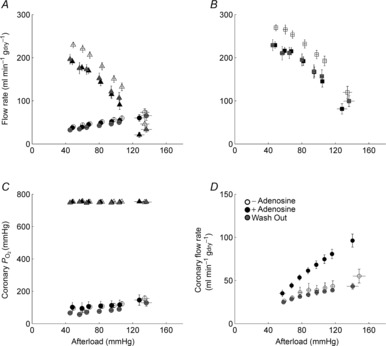
Figure 1. Aortic and coronary flow as functions of afterload.

A, aortic (triangles) and coronary (circles) flow rates, and B, total ventricular outflow (the sum of aortic and coronary flow rates, significantly higher in the REF group) as functions of afterload. C, upstream (coronary arterial)  (triangles) and downstream (coronary venous)
  (circles) as functions of afterload at a preload of 10 mmHg. Symbols represent mean ± SEM of n = 9 REF (open symbols), n = 14 FO (black symbols) and n = 14 SFA (grey symbols) diet groups . D, coronary flow rate before (‘– Adenosine’), during (‘+ Adenosine’) and after (‘Wash Out’) 5 μm adenosine (mean ± SEM, n = 2).
