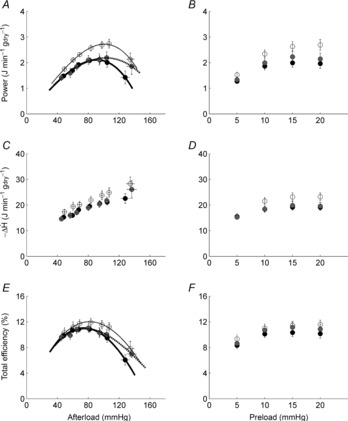
Figure 2. Power, rate of change of enthalpy and total efficiency as functions of afterload and preload for the three diet groups.

Values are means ± SEM of n = 9 REF (open circles), n = 14 FO (filled circles) and n = 14 SFA (grey circles) working hearts. Power and efficiency data were fitted with third-order polynomial functions.
