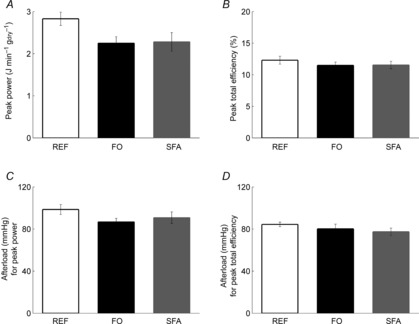
Figure 3. Peak power and peak total efficiency of the whole heart, and the afterloads at which they occur.

Peak power (A) and peak total efficiency (B), and the afterloads yielding the respective peak power (C) and peak total efficiency (D); values are mean ± SEM from n = 9 REF, n = 14 FO and n = 14 SFA hearts.
