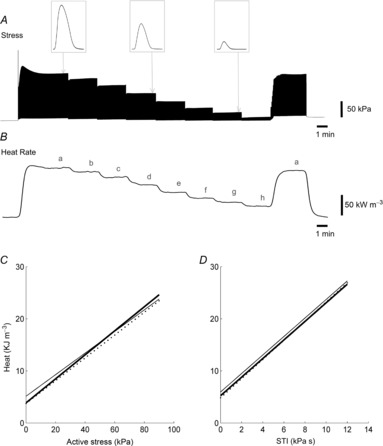
Figure 7. Typical experimental records arising from the isometric length-change protocol.

Twitch stress (A) and rate of heat output (B) of a trabecula at various lengths (b–h) below its optimal length (a). Insets in A represent individual twitch profiles at lengths a, e and g. Linear regression of the average heat–stress relationships (C) and the average heat–STI relationships (D) for the three diet groups: REF (thin line), FO (thick line) and SFA (broken line); no differences among diet groups.
