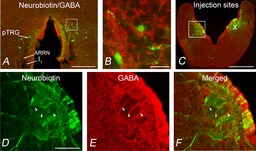
Figure 3. Distribution of GABA immunoreactivity in the pTRG region and the vagal motor nucleus.

A, photomicrograph of a transverse section from the isthmic region at the level of the pTRG showing retrogradely labelled neurons (green) after bilateral injections of neurobiotin into the vagal motoneuron pools. GABA immunoreactivity is shown in red. B, photomicrograph at a higher magnification of the portion of the transverse section (white box in A) showing retrogradely labelled neurons in the pTRG surrounded by GABA-immunoreactive structures. C, photomicrograph of a transverse section in the caudal rhombencephalon showing the site of bilateral neurobiotin injections into the vagal motor nuclei. The distribution of GABA immunoreactivity is shown in red. D–F, photomicrographs at a higher magnification of the portion of the transverse section indicated by the white box in C. Arrowheads point to GABAergic fibres surrounding the cell bodies of vagal motoneurons. D, vagal motoneurons stained by neurobiotin injection. E, GABA-immunoreactive structures. F, merged image. Scale bars, 200 μm in A, 25 μm in B, 500 μm in C, 100 μm in D–F. ARRN, anterior rhombencephalic reticular nucleus; I1, isthmic Müller cell; pTRG, paratrigeminal respiratory group; X, vagal motor nucleus.
