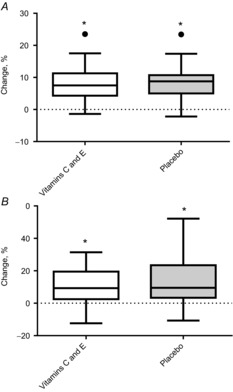
Figure 4. Percentage changes in  and the 20 m shuttle run test in the vitamin C and E group and the placebo group.

A, changes in  . B, changes in 20 m shuttle run. Boxplots show maximum–minimum values, 25–75th quartiles, and medians. ●, outliers (Tukey's rule); #, difference between groups; *, within-group changes.
