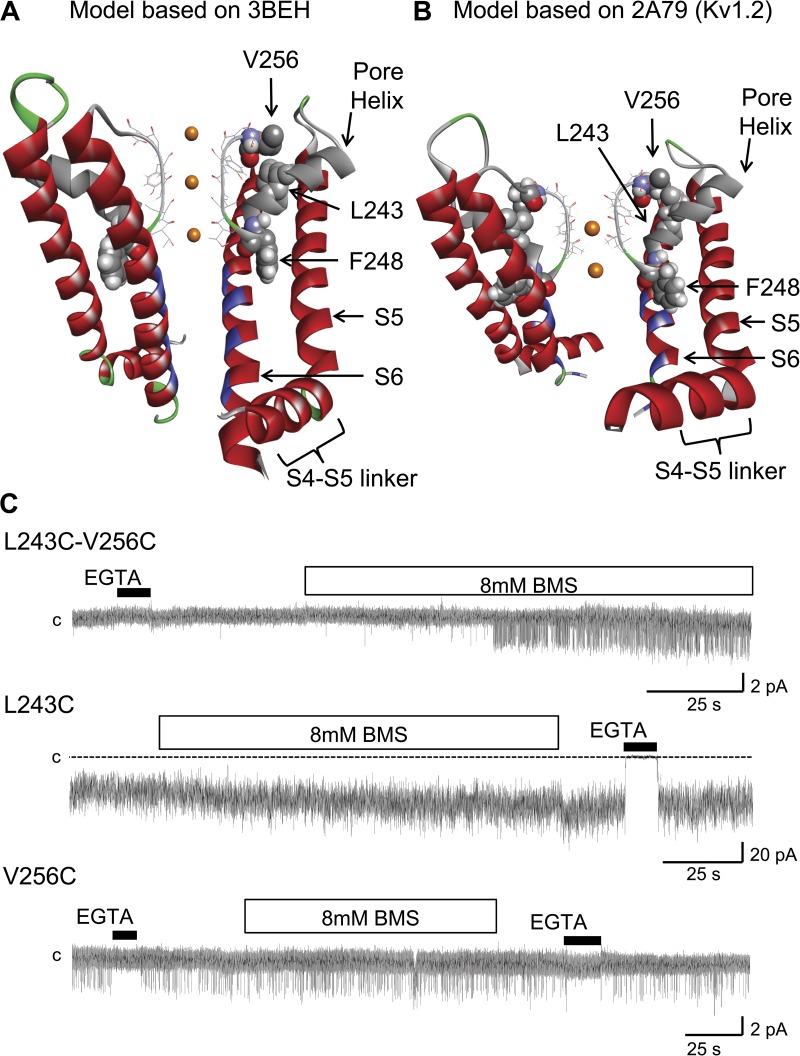
Figure 1.
Ribbon representation of the KCa3.1 pore region, including the S4–S5 cytosolic linker, the S5 and S6 transmembrane helices, the pore helix (gray), and the selectivity filter regions (stick representation). (A) Model structure generated by MODELLER9.11 using as template the crystal structure solved for a bacterial cyclic nucleotide–regulated channel MlotiK1 (Protein Data Bank accession no. 3BEH). Also shown is a space-filling representation of residues L243, F248, and V256, with the L243 side chain projecting opposite to the S5 and S6 transmembrane segments toward V256 of the selectivity filter. In contrast, F248 is predicted to be oriented with its side chain making contact with both the S5 and S6 helices. The residues documented to be facing the channel pore are colored in blue (Klein et al., 2009). (B) Model structure generated by MODELLER9.11 using as template the crystal structure solved for the mammalian Kv1.2 channel (Protein Data Bank accession no. 2A79). As in A, residue F248 is seen as projecting between the transmembrane helices S5 and S6. Only two subunits are presented for clarity. (C) Inside-out patch recordings supporting the formation of a disulfide bond between Cys engineered at 256 and 243. The reducing agent BMS caused channel activation when applied onto the L243C–V256C double mutation channel but failed to affect channel activity when applied to the V256C (single-channel) and L243C (multi-channel) single mutation channels. These observations support the orientation of the pore helix relative to the selectivity filter proposed in A and B. Channels were expressed in Xenopus oocytes, and current records were obtained at −60 mV in symmetrical 200-mM K2SO4 conditions at an internal Ca2+ concentration of 25 µM. The label “c” refers to the zero current level. Illustration by Discovery Studio Visualizer (Accelrys).

