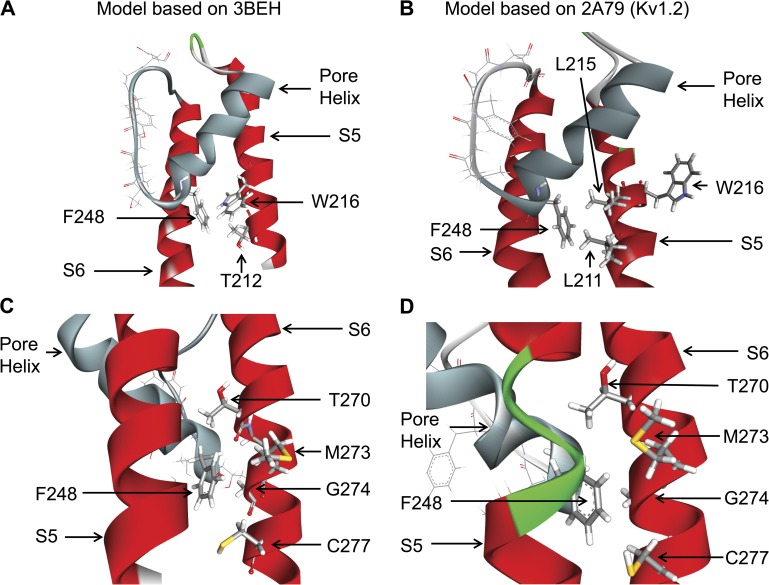
Figure 3.
Detailed representations of the KCa3.1 channel pore helix region (gray) derived either from the 3BEH (bacterial nucleotide–activated potassium channel) or 2A79 (Kv1.2) templates. A and B illustrate that the interface between F248 and the S5 transmembrane helix is template dependent, with F248 predicted to be interacting with W216 and T212 of S5 for the 3BEH-derived model but with L211 for the model obtained using the Kv1.2 structure (2A79) as template. C and D show in contrast a structural organization of the interface between F248 and the S6 transmembrane segment in which F248 is in both cases within proximity of the Gly hinge at 274 on S6 added to potential contacts with C277, M273, and T270. Illustrations by Discovery Studio Visualizer (Accelrys).

