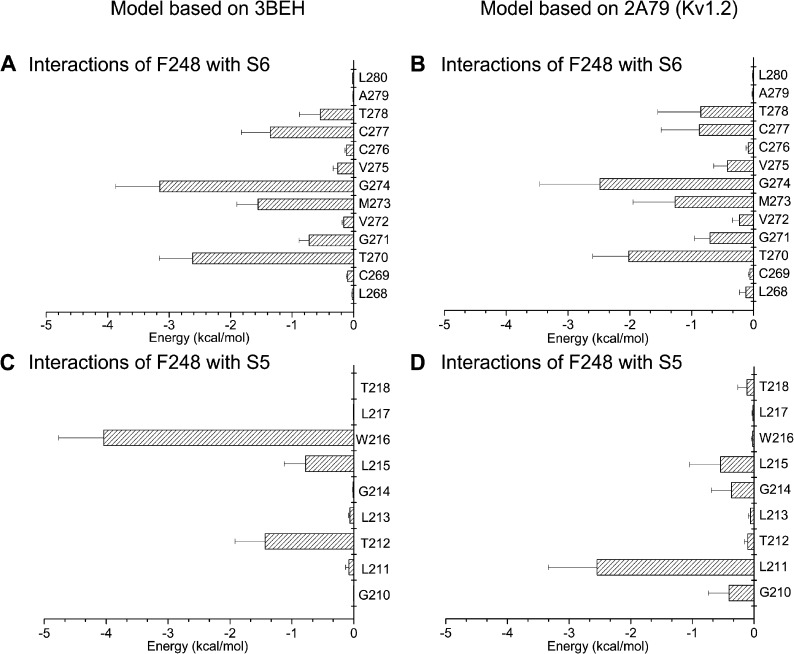
Figure 4.
Electrostatic and van der Waals interaction energy between F248 and residues L268 to L280 of S6 (A and B) or residues G210 to T218 of S5 (C and D). Energy calculations were based on 64-ns MD trajectories obtained for the KCa3.1 model derived either from the 3BEH (nucleotide-activated) or 2A79 (Kv1.2) templates. The bar graphs in A and B indicate that F248 of the pore helix strongly interacts with the Gly hinge at 274 for both models and to a lesser extent with T270, M273, C277, and T278. The interaction energy pattern remained overall template independent. In contrast, strong interaction energies were estimated between F248 and W216 for the KCa3.1 model derived from the 3BEH template, whereas the maximum interaction energy for the KCa3.1 2A79-derived model involves residues F248 and L211. This analysis thus indicates that the interaction energy pattern between F248 and residues in S5 varies according to the template used.

