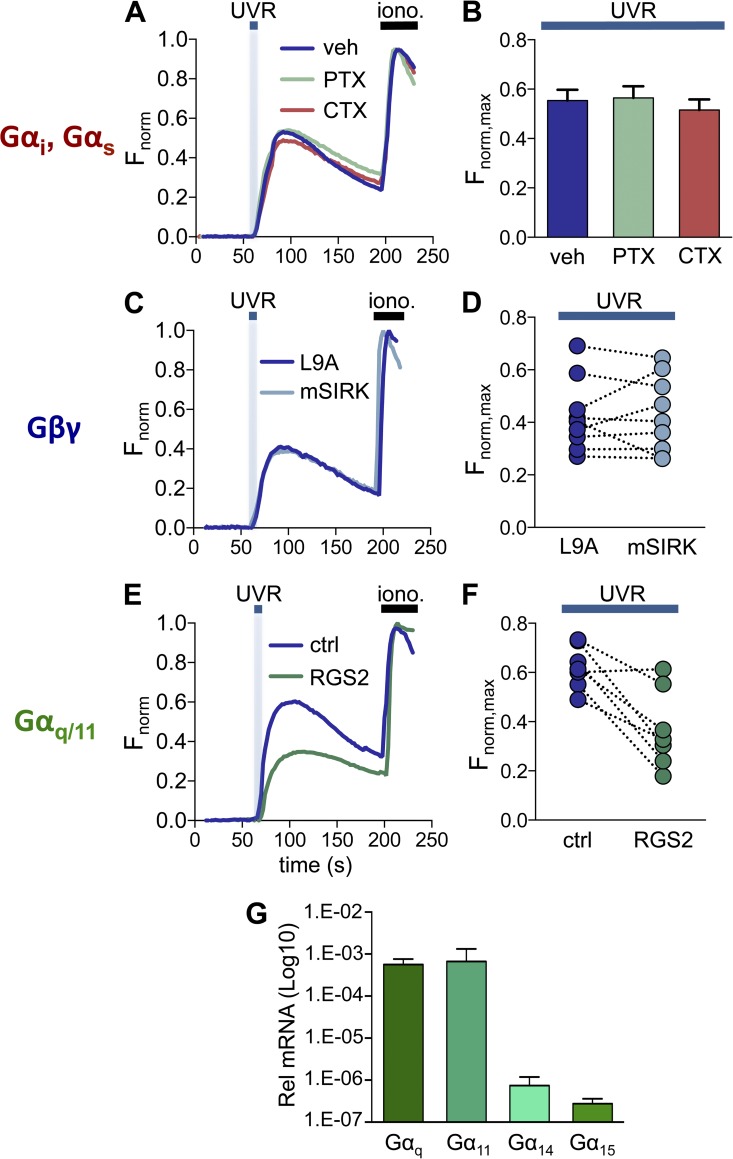
Figure 1.
Impaired Gαq/11 signaling, but not Gαs, Gαi/o, or Gβγ signaling, diminishes UVR-induced Ca2+ responses in HEMs. (A) HEMs treated with the Gαs signaling inhibitor CTX (500 ng/ml), the Gαi/o inhibitor PTX (500 ng/ml), or vehicle (water) have similar retinal-dependent Ca2+ responses (Fnorm) to 150 mJ/cm2 UVR. Each trace was normalized to the response elicited by ionomycin (iono., 1 µM), added at the end of each experiment. n = 7–10 cells from one experiment averaged for each trace. (B) The mean peak Ca2+ responses (Fnorm,max) elicited by 150 mJ/cm2 UVR were not altered when HEMs were treated with CTX or PTX, as compared with vehicle control. n = 7 experiments per condition, ±SEM (error bars). (C) HEMs stimulated with 150 mJ/cm2 UVR and treated with the Gβγ peptide inhibitor mSIRK (10 µM) or its inactive analogue L9A (10 µM) had similar retinal-dependent Ca2+ responses (Fnorm). n = 6–10 cells from one experiment averaged for each trace. (D) Mean UVR-induced (150 mJ/cm2) peak retinal-dependent Ca2+ responses (Fnorm, max) were not significantly different in HEMs treated with the Gβγ peptide inhibitor mSIRK versus its inactive analogue L9A. n = 9 paired experiments. (E) HEMs expressing RGS2 exhibited reduced retinal-dependent Ca2+ responses (Fnorm) to 150 mJ/cm2 UVR compared with control (mCherry-transfected) cells. n = 3–11 cells from one experiment averaged for each trace. (F) In paired experiments the mean amplitude of the retinal-dependent Ca2+ responses (Fnorm,max) in RGS2-expressing HEMs stimulated with UVR (150 mJ/cm2) was diminished compared with control cells. n = 8 experiments per condition, P < 0.004. (G) qPCR analysis of mRNA levels of Gαq/11 family members (Gαq, Gα11, Gα14, and Gα15) in HEMs, relative to actin. Bars represent mean ± SEM (error bars) from n = 3 independent experiments.

