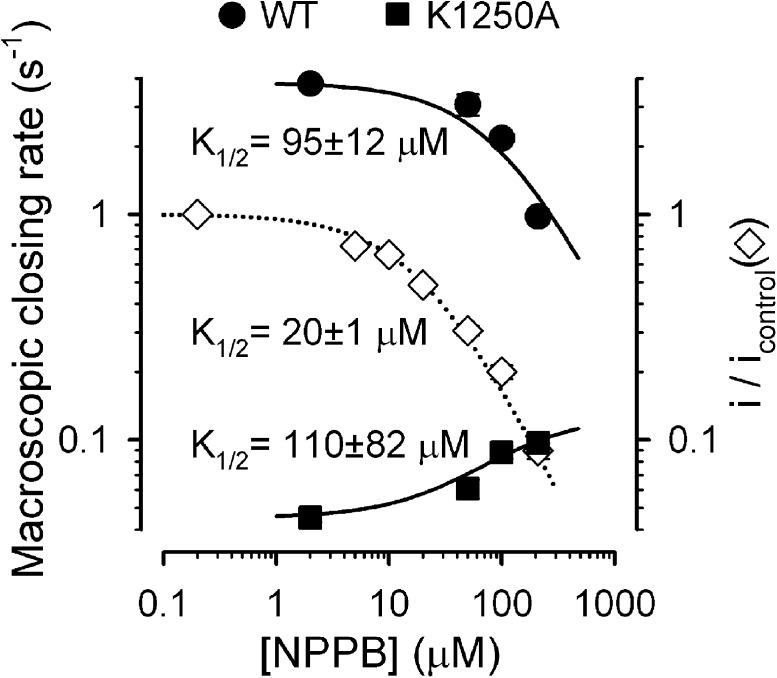
Figure 10.
Dose dependence of NPPB gating effects. Macroscopic closing rates of WT (closed circles) and K1250A (closed squares) CFTR in the presence of various cytosolic [NPPB], measured at −120 mV using the protocols shown in Figs. 3 A and 4 A, respectively; leftmost data points represent control values in the absence of NPPB. The 50- and 100-µM data points for K1250A were measured at −40 mV. Solid lines are fits to the equation rOC([NPPB]) = r0 + (r∞ − r0)([NPPB]/([NPPB] + K1/2)), with r∞ fixed to zero for WT but left free for K1250A; K1/2 values are plotted. Open diamonds and dotted line depict fractional pore block at −120 mV, replotted from Fig. 1 J.

