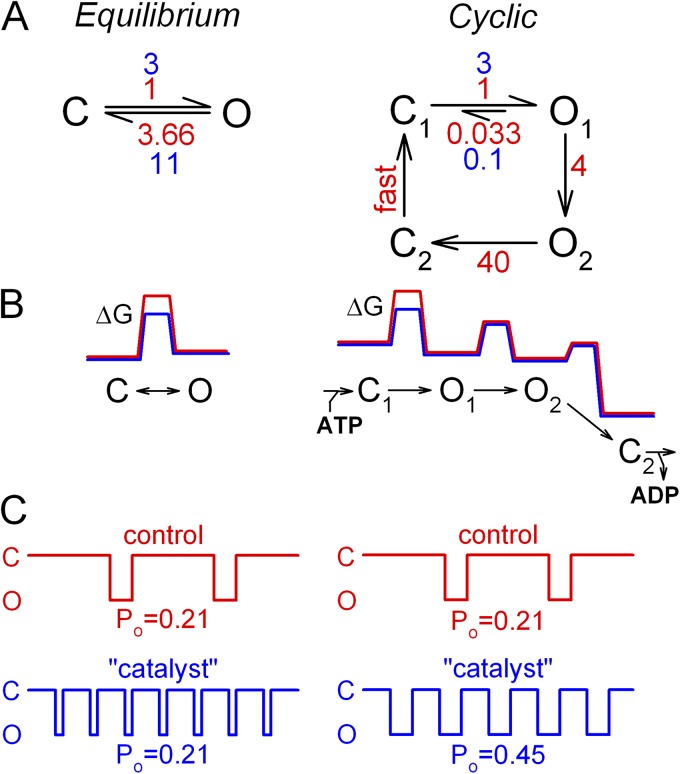
Figure 11.
Catalyst effect as a unique strategy to enhance Po of a nonequilibrium ion channel. (A) Simple equilibrium scheme (left) and cyclic nonequilibrium scheme (right; compare to cartoons in Figs. 3–5), with transition rates in the absence (red) and presence (blue) of a catalyst for step C↔O (left) or C1↔O1 (right). (B) Free energy profiles (not drawn to scale) for the schemes in A, in the absence (red) and presence (blue) of the same catalyst. (C) Illustration of channel gating patterns, and calculated Po, for the schemes in A, in the absence (red) and presence (blue) of the catalyst.

