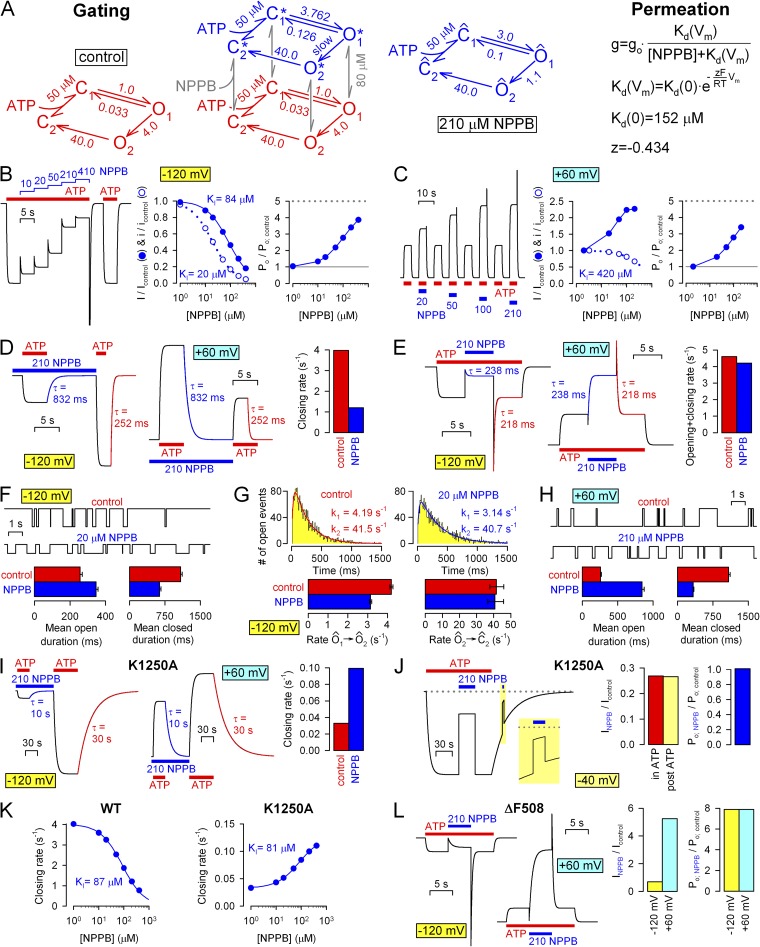
Figure 12.
Full kinetic model of NPPB effects on CFTR gating and permeation. (A; left) Two-tiered kinetic model of NPPB gating effects (cube). States C1, O1, O2, and C2 (red) correspond to the four states depicted in the cartoons in Figs. 3–5 and represent states in which NPPB is not bound at its “gating site.” The C2↔C1 transition, which reflects exchange of ADP for ATP at site 2, is modeled as a single step, with a Kd of 50 µM for ATP. For simplicity, a single voltage-independent Kd of 80 µM is used to characterize rapid binding/unbinding of NPPB to the gating site in all four conformational states (vertical transitions; gray arrows). States C1*, O1*, O2*, and C2* (blue) are conformational states analogous to C1, O1, O2, and C2, but with NPPB bound at the gating site. In 0 or 210 µM NPPB, the full model (cube) reduces to the four-state models to its left (red) and right (blue), respectively; states in the blue reduced model are compound states ( = {C1; C1*}, = {O1; O1*}, etc.), and printed rates are apparent rates of transition between them. (Right) Voltage and dose dependence of pore block by NPPB is modeled as an instantaneous effect on apparent unitary conductance (g) and is approximated by the Boltzmann equation with parameters printed (g0, control unitary conductance; T, temperature in Kelvin; R = 8.31 J · mol−1 · K−1; F = 96,500 C · mol−1). (B–L) Predictions of the model in A for the experimental protocols and analysis results obtained in this study. Macroscopic current time courses for the experimental protocols in B–E and I–L were calculated, whereas single-channel traces for F–H were simulated using standard Q-matrix techniques (Colquhoun and Sigworth, 1995). Rate O1*→O2* was tentatively set to zero. Gating effects of the K1250A mutation were modeled by setting rate O1→O2 to zero while increasing the Kd for ATP to 5 mM (Vergani et al., 2003), those of the ΔF508 mutation were modeled by decreasing rate C1→O1 30-fold while increasing rate O1→C1 threefold (Miki et al., 2010; Jih et al., 2011). Analysis of macroscopic currents was done as described in Figs. 2–4, 6, 7, and 10. For F and H, five independent events lists, containing 100 open events each, were simulated for each condition; bar charts show mean ± SEM of obtained mean open and closed times. Open duration histograms in G were created from 3,000 simulated open events for both conditions and fitted by maximum likelihood as described for Fig. 5 (C–E).

