Figure 3.
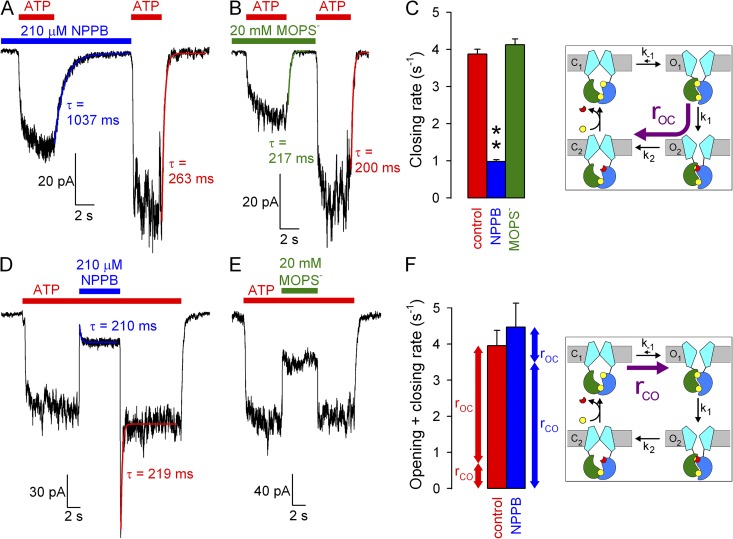
Effects of NPPB and MOPS− on WT CFTR opening and closing rate. (A and B) Macroscopic WT CFTR currents at −120 mV elicited by brief exposures to 2 mM ATP in the absence or presence of (A) 210 µM NPPB or (B) 20 mM MOPS−; colored lines, single-exponential fits (τ, time constants). (C) Macroscopic closing rates (bars, rOC = 1/τ) in the absence (red) and presence of NPPB (blue) or MOPS− (green). (D and E) Macroscopic WT CFTR currents in 2 mM ATP at −120 mV, and brief exposure to (D) 210 µM NPPB or (E) 20 mM MOPS−. Colored lines in D, single-exponential fits. (F) Sums of opening and closing rates in the absence and presence of NPPB (1/τ from D); opening rates (rCO, bottom vertical arrows) are estimated by subtraction of closing rates (rOC, top vertical arrows; see C) from the sums. Cartoons in C and F (also in Figs. 4, B and E, and 5, B and E) depict simplified cyclic CFTR gating model: cyan, TMDs; green, NBD1; blue, NBD2; yellow, ATP; red, ADP. Purple arrows highlight the pathway under study.

