Figure 5.
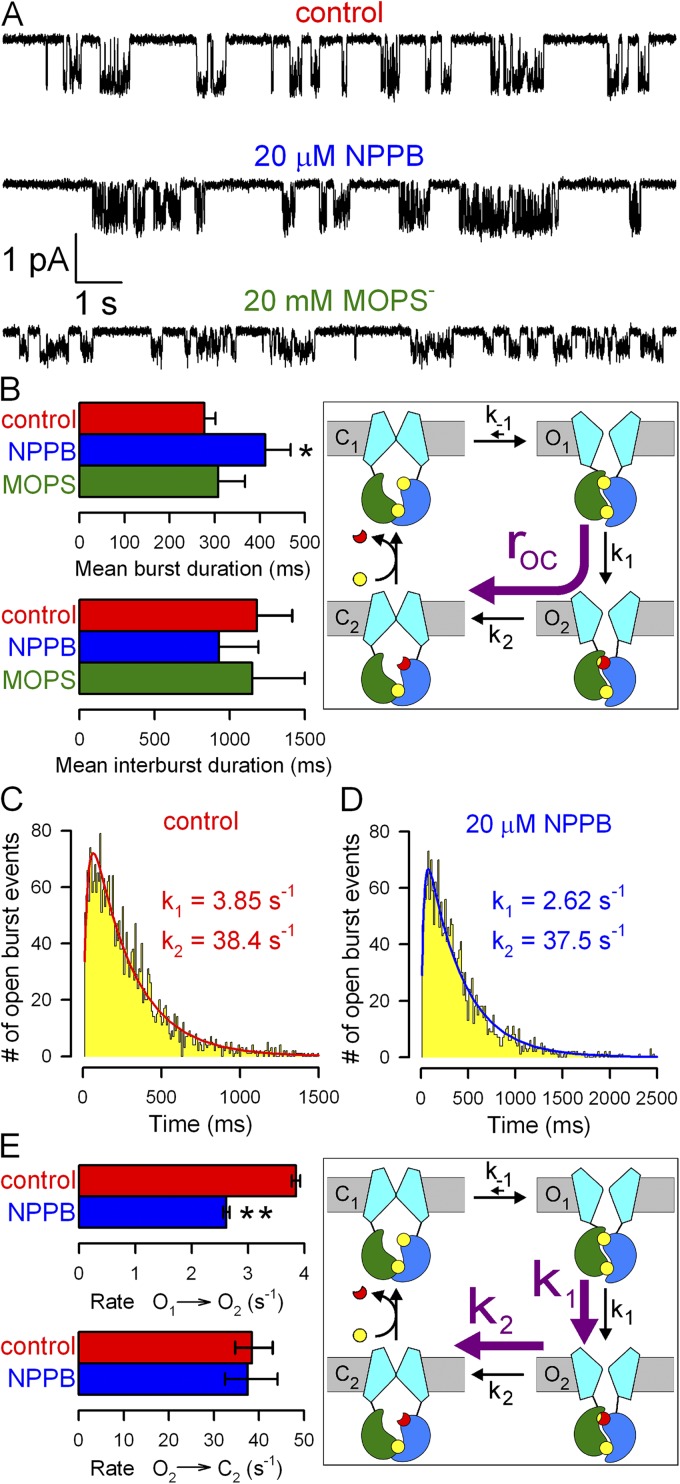
Effects of NPPB and MOPS− on WT CFTR microscopic steady-state gating parameters. (A) Currents from single WT CFTR channels at −120 mV in 2 mM ATP ± blockers; bandwidth, 100 Hz. (B) Mean burst (τb) and interburst (τib) durations (bars) in 2 mM ATP (red), 2 mM ATP plus 20 µM NPPB (blue), and 2 mM ATP plus 20 mM MOPS− (green); closing rate (cartoon, purple arrow) is 1/τb. Bars were generated from data originating from 15, 10, and 9 patches, respectively, for the control, NPPB, and MOPS conditions; error bars represent SEM. (C and D) Dwell-time histograms of burst durations of WT CFTR channels at −120 mV in 2 mM ATP (C; 2,999 bursts, pooled from 15 patches) or 2 mM ATP plus 20 µM NPPB (D; 2,069 bursts, pooled from 10 patches) and maximum likelihood fits (solid lines) to the scheme cartooned in E (with k-1 fixed to zero). (E) Estimates of rates k1 (step O1→O2) and k2 (step O2→C2) in ATP and ATP plus 20 µM NPPB. Asymmetric error bars represent 0.5-unit log-likelihood intervals.

