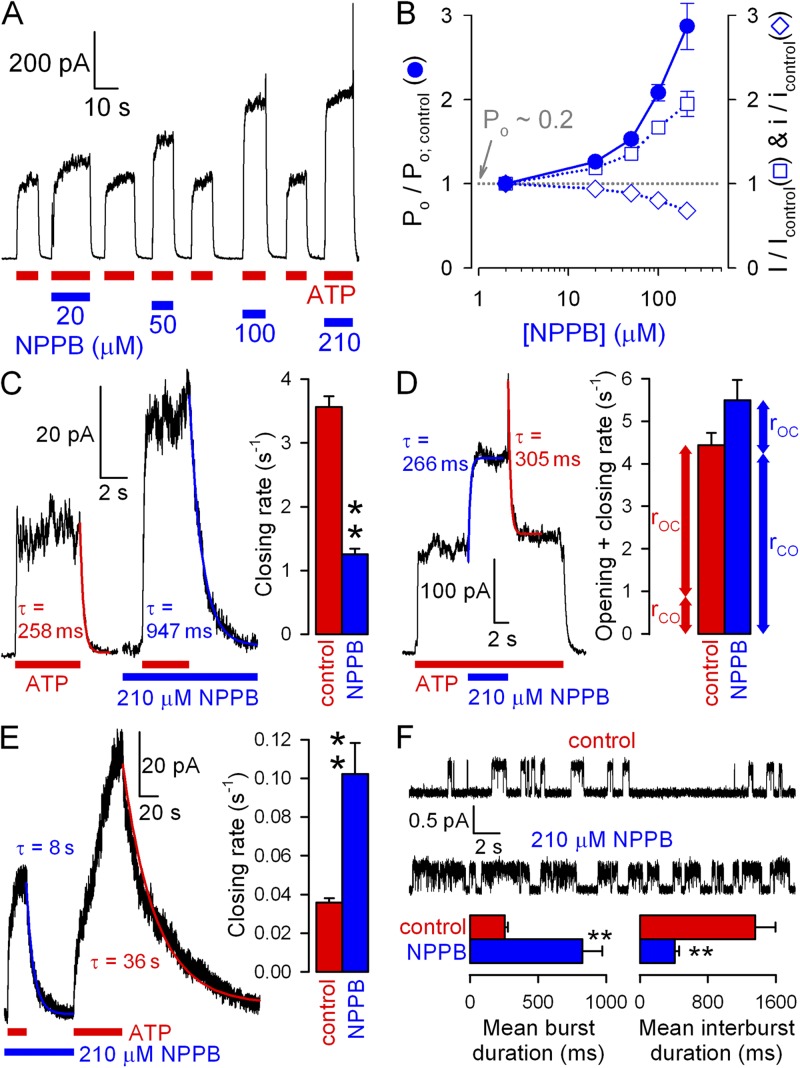
Figure 6.
Gating stimulation by NPPB is largely voltage independent. (A) Dose-dependent stimulation by NPPB of steady-state macroscopic WT CFTR currents in 2 mM ATP at +60 mV. (B) Dose–response curves for fractional effects of NPPB on steady-state macroscopic current I (open squares; obtained from A), on unitary current i (open diamonds; obtained as in Fig. 1I), and on Po (closed circles; obtained as in Fig. 2 E). (C; left) Macroscopic WT CFTR current at +60 mV elicited by brief exposures to 2 mM ATP in the absence or presence of 210 µM NPPB; colored lines, single-exponential fits (τ, time constants). (Right) Macroscopic WT closing rates (bars, 1/τ) in the absence (red) and presence of NPPB (blue). (D; left) Macroscopic WT CFTR current in 2 mM ATP at +60 mV and brief exposure to 210 µM NPPB; colored lines, single-exponential fits (τ, time constants). (Right) Sums of opening and closing rates (bars, 1/τ) in the absence and presence of NPPB; opening rates (rCO, bottom vertical arrows) are estimated by subtraction of closing rates (rOC, top vertical arrows) from the sums. (E; left) Macroscopic K1250A CFTR current at +60 mV elicited by exposures to 10 mM ATP in the absence or presence of 210 µM NPPB; colored lines, single-exponential fits (τ, time constants). (Right) Macroscopic K1250A closing rates (bars, 1/τ) in the absence (red) and presence (blue) of NPPB. (F; top) Currents from a single WT CFTR channel gating at +60 mV in 2 mM ATP before (top trace) and during (bottom trace) exposure to 210 µM NPPB; bandwidth, 100 Hz. (Bottom) Mean burst (left) and interburst (right) durations (bars) of WT CFTR in 2 mM ATP (red) and 2 mM ATP plus 210 µM NPPB (blue) at +60 mV. Bars were generated from 16 segments of record in ATP and 15 segments in ATP plus NPPB originating from nine patches; error bars represent SEM.

