Figure 9.
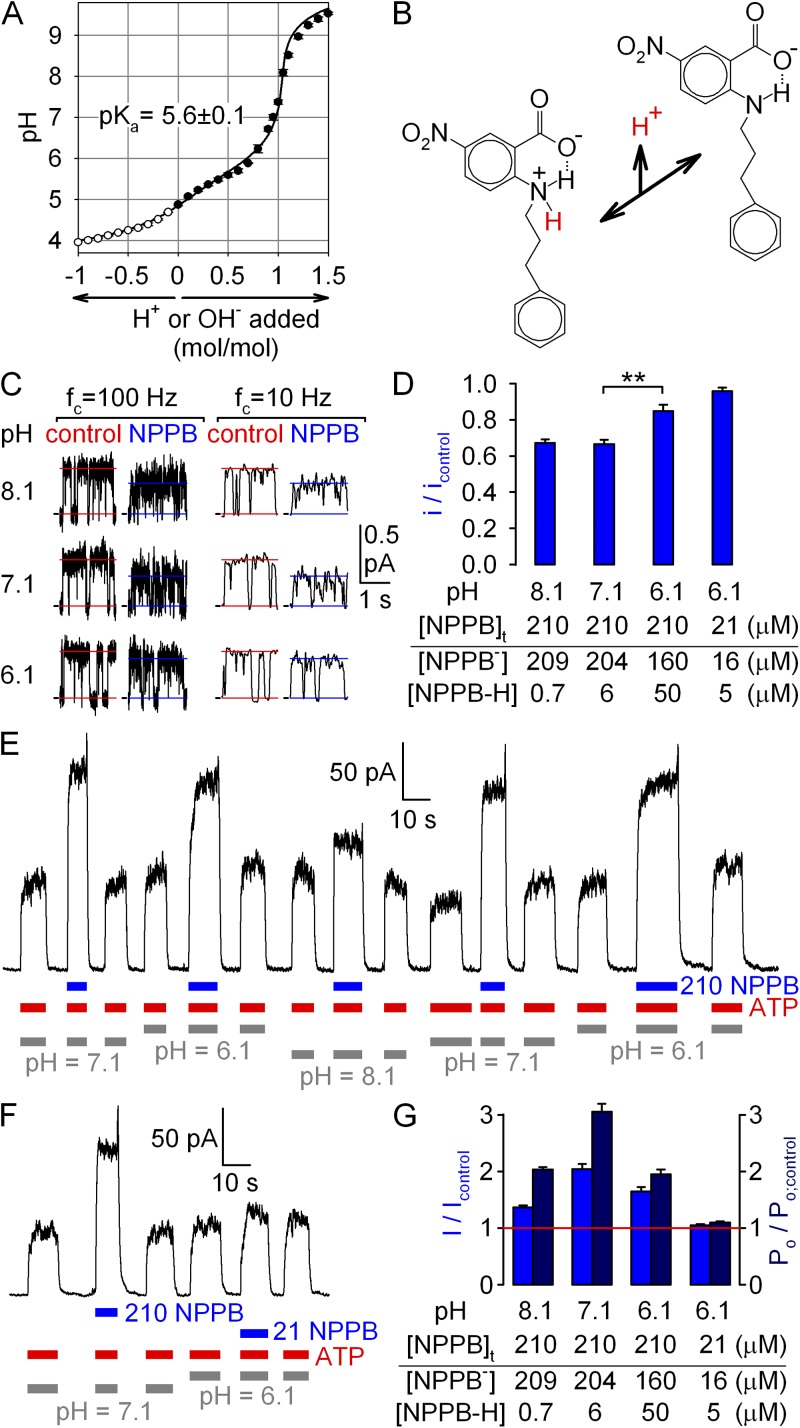
Anionic form of NPPB is responsible for the observed gating effects. (A) Titration curve of NPPB; 10 ml 100 µM NPPB (in H2O) was titrated with 10-µl aliquots of either 10 mM NaOH (closed symbols; n = 3) or 10 mM HCl (open symbols; n = 2, plotted on negative side of abscissa). Solid line is a fit to the titration curve of a monoprotic weak acid, corrected for the presence of 10 mM CO2 (see Materials and methods); fitted pKa is plotted. (B) Structures of protonated (zwitterionic) and deprotonated (anionic) forms of NPPB; the proton released with a pKa of ∼5.6 is highlighted in red; dotted line depicts suggested hydrogen bond. (C) Segments of unitary current at +60 mV from a single locked-open E1371S CFTR channel in symmetrical ∼140-mM Cl− at three different cytosolic pH values, with and without cytosolically applied 210 µM NPPB, displayed at two bandwidths (fc, filter corner frequency). Horizontal lines depict closed current level and average current through a bursting channel. (D) Apparent unitary amplitudes (of heavily filtered currents), normalized to those obtained in the absence of NPPB at the respective pH (bars). Table lists concentrations of anionic and uncharged NPPB for the tested conditions, calculated using a pKa of 5.6. (E and F) Stimulation at +60 mV of steady-state macroscopic WT CFTR currents in 2 mM ATP (red bars) by the application of (E and F) 210 µM NPPB (blue bars) at bath pH values of 6.1, 7.1, and 8.1 (gray bars), or of (F) 21 µM NPPB at a bath pH value of 6.1. (G) pH dependence of fractional effects of NPPB on steady-state macroscopic current I (blue bars; obtained from E and F), and on Po (dark blue bars; Po/Po; control was calculated as the ratio (I/Icontrol):(i/icontrol)). (Table) Concentrations of anionic and uncharged NPPB for the tested conditions, assuming pKa = 5.6.

