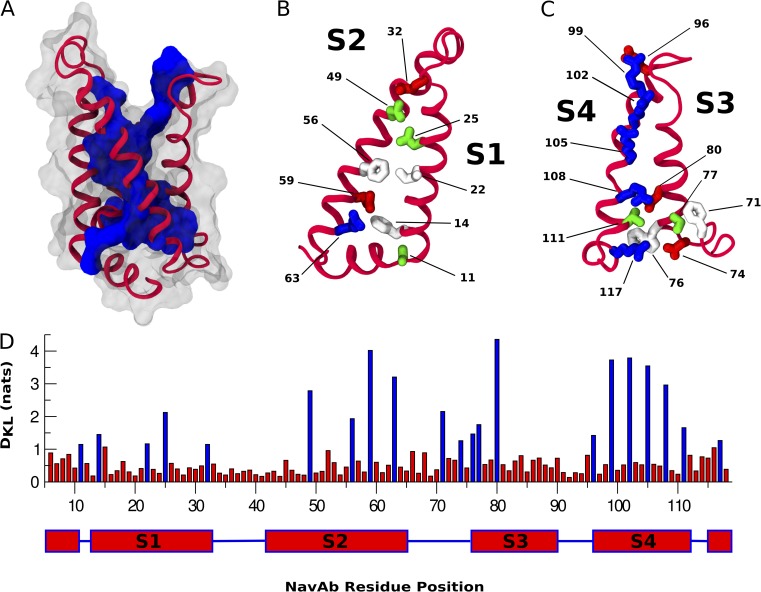
Figure 4.
Single-site analysis of the VSD. (A) Cartoon representation of the NavAb VSD. Residues with a DKL score greater than the 1.1-nat threshold are represented as a contiguous blue surface. Residues with a DKL score below the threshold are transparent. (B and C) Helices S1–S4 of the NavAb VSD. Residues with a DKL score greater than the 1.1-nat threshold are represented as licorice and colored as in Fig. 1. (D) DKL score by NavAb residue position with residue positions above the 1.1-DKL threshold represented as blue bars.

