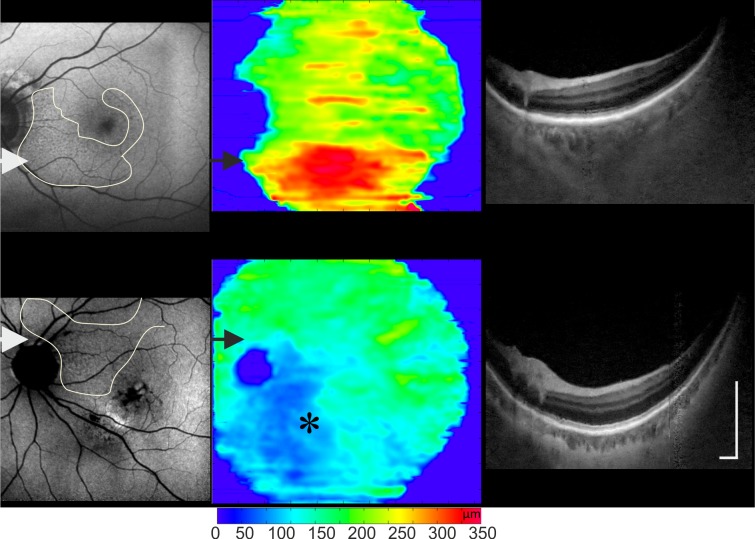
Figure 2.
Reticular pseudodrusen and ChT distribution for three different examples: a nonneovascular AMD, neovascular AMD (the location of the CNV is marked with *) viewed on FAF, and 3D 1060-nm OCT ChT maps and OCT tomograms (location shown by the arrows). Areas with RPD correspond (contour lines on FAF images) to areas of increased ChT in each example. Scale bar: 0.5 mm.

