Figure 4.
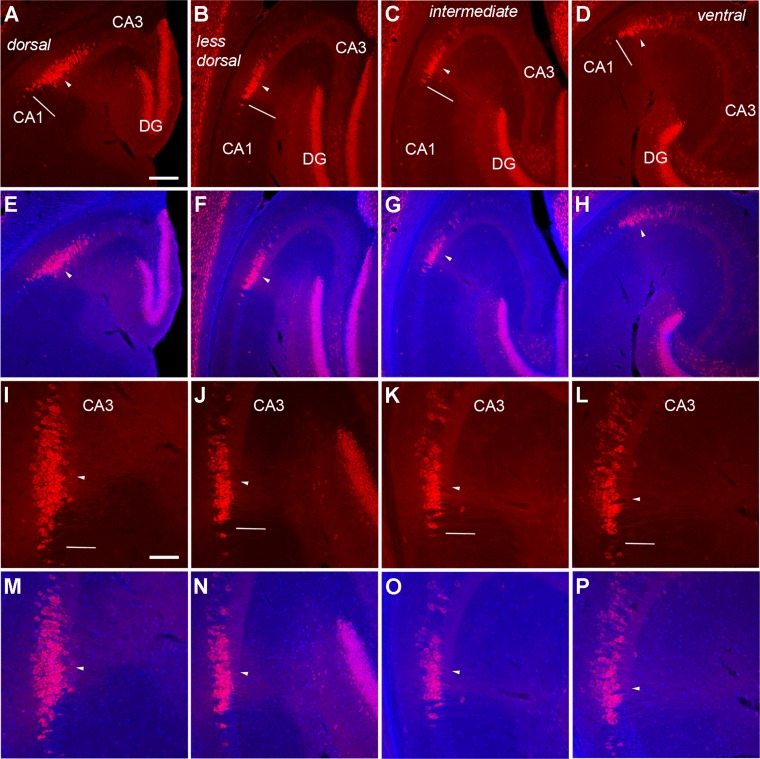
PCP4 staining varies along the dorsal–ventral axis across horizontal sections of adult mouse hippocampus. The images of PCP4 immunostaining (A–D, I–L) and PCP4/DAPI staining overlays (E–H, M–P) of the example sections from dorsal (A,E,I,M), less dorsal (B,F,J,N), intermediate (C,G,K,O), and ventral levels (D,H,L,P) taken under lower (A–H) versus higher power (I–P) objectives. PCP4 staining is denser and more widespread in dorsal regions of the adult mouse hippocampus. The arrowhead indicates the end of the mossy fiber tract and beginning of CA2, and the short bar indicates the border between CA2 and CA1 as determined by cytoarchitectural structure revealed by DAPI staining. For quantification, the dorsal and less dorsal sections were pooled for the dorsal group, and the intermediate and ventral sections were pooled for the ventral group. Scale bar = 200 μm in A (applies to A–H); 100 μm in I (applies to I–P).

