Fig. 3.
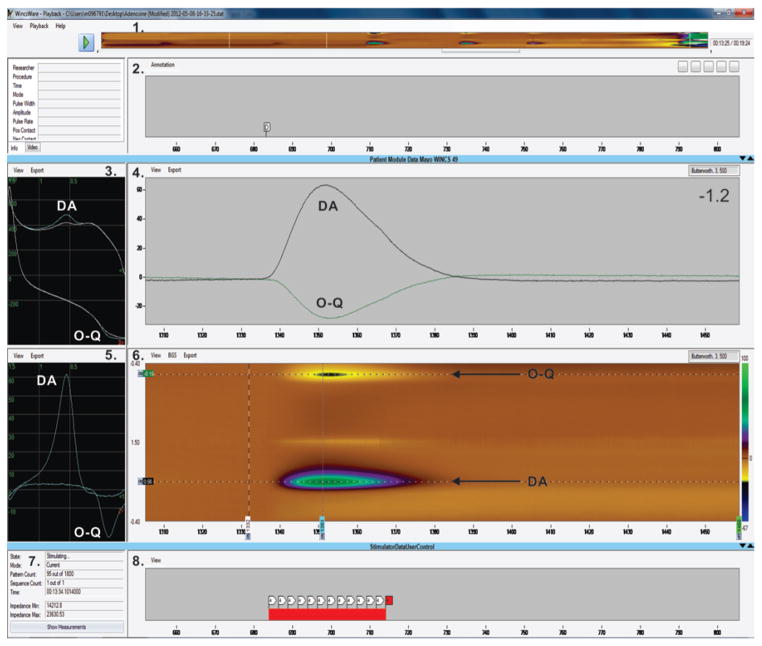
An example of the WincsWare user interface displaying acquired data in nearly real time. The displayed elements include 1) a color plot depicting data acquired throughout a recording session; 2) a panel displaying user-entered annotations; 3) raw (not background-subtracted) voltammograms, plotting electrode current as a function of applied potential for an FSCV scan. The blue line shows dopamine (DA) oxidation and orthoquinone (O–Q) reduction peak currents superimposed on the white line of the background current; 4) a current-versus-time strip chart of electrode currents measured at 1 or more selected applied potentials (typically the oxidation and reduction potentials for the analyte of interest; in this case, oxidation of DA and reduction of O–Q); 5) a background-subtracted voltammogram, here showing peaks for DA oxidation (at +0.56 V) and O–Q reduction (at −0.16 V); 6) the color plot of electrode current (represented by horizontal color traces) as a function of applied potential (vertical axis) for a sequence of FSCV scans over time (horizontal axis), here showing DA oxidation (green trail at +0.56 V) and O–Q reduction back to DA (yellow and black trail at −0.15 V); 7) stimulation status information, including pattern and sequence count, elapsed time of stimulation, stimulating electrode impedance (calculated on the basis of measured stimulus current and voltage); and 8) a strip chart displaying intervals of stimulation. In panels 3 and 5, <1 indicates a forward direction (−0.4 V → +1.5 V) and <2 indicates a backward direction (+1.5 V → −0.4 V). The units on the x axes in panels 2, 4, 6, and 8 are seconds, and in panels 3 and 5 they are volts. The units on the y axis in panels 3–5 are nA and in panel 6 they are volts.

