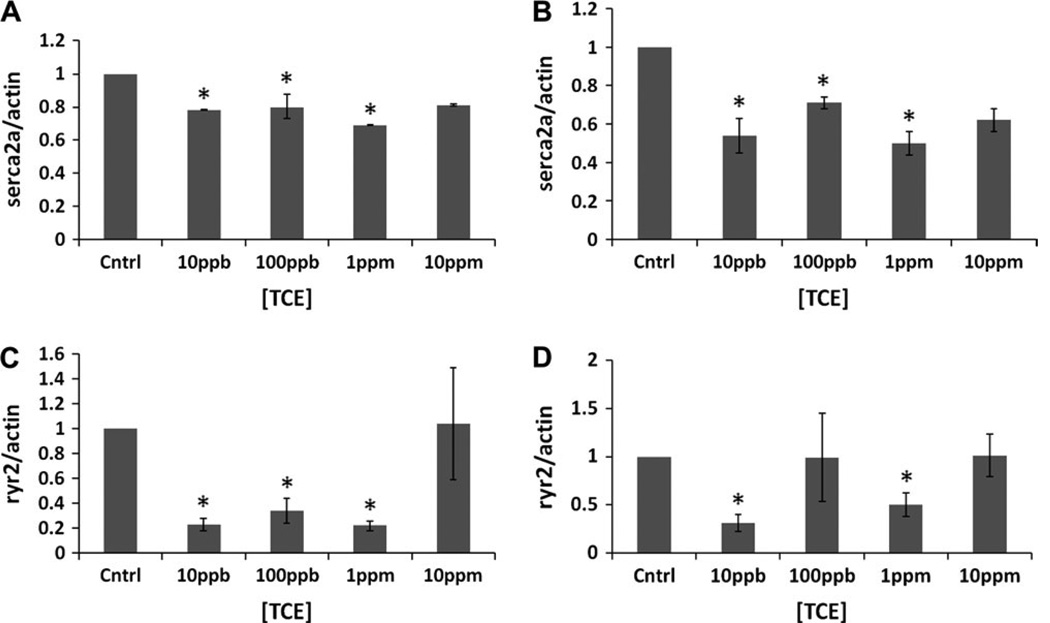
Figure 2. Dose-response analysis.
Real –time PCR analysis of Serca2a (2A and B) and Ryr2 (2C and D) transcripts was performed in H9c2 cells exposed to different doses of TCE (10 and 100 ppb, 1 and 10 ppm) for either 12 (A and C) or 48 hours (B and D). Fold expression at each dose was calculated against control (without TCE) as a ratio between Serca2a and B-actin. Graphs in A and B represent the average of three independent experiments. Each experiment point was tested in triplicate. [*] identify significant differences as determined by Student’s t-test (p < 0.05). Graphs in C and D represent the average of two independent experiments, each one was repeated at least two times.

