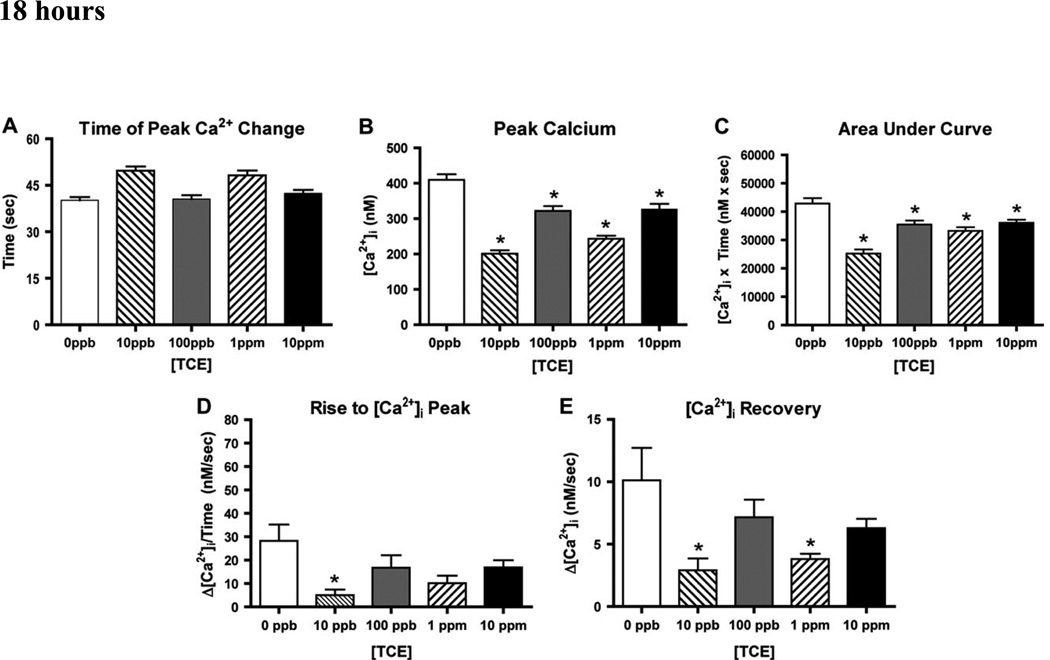
Figure 4. H9c2 Ca2+ Response to TCE after 18 hours.
H9c2 cardiac cells were cultured in the absence of TCE (0 ppb) or with 10 ppb – 10 ppm TCE for 18 hours. Cells were then stimulated with 1nM VP and evaluated for Ca2+ parameters described in Figure 3. (A): The time (in seconds) required to reach the peak [Ca2+] was calculated for all treatments. (B): The peak [Ca2+] reached in each treatment group was compared to control unexposed cells (0ppb). (C): Area under the curve represents total [Ca2+] flux determined in 150 seconds, as illustrated in Figure 3. (D): Rise to peak represents the ratio between [Ca2+] determined at the beginning of the cell response to VP (time 0) and at the time when the peak was reached in each group. (E): “Calcium recovery” is the ratio between [Ca2+] measured at peak and at the return to baseline (slope C in Figure 3). [*] denotes significant difference determined by ANOVA (P<0.05); [**] denotes significant difference compared to 0 ppb as determined by Student’s t-test (p < 0.05).

