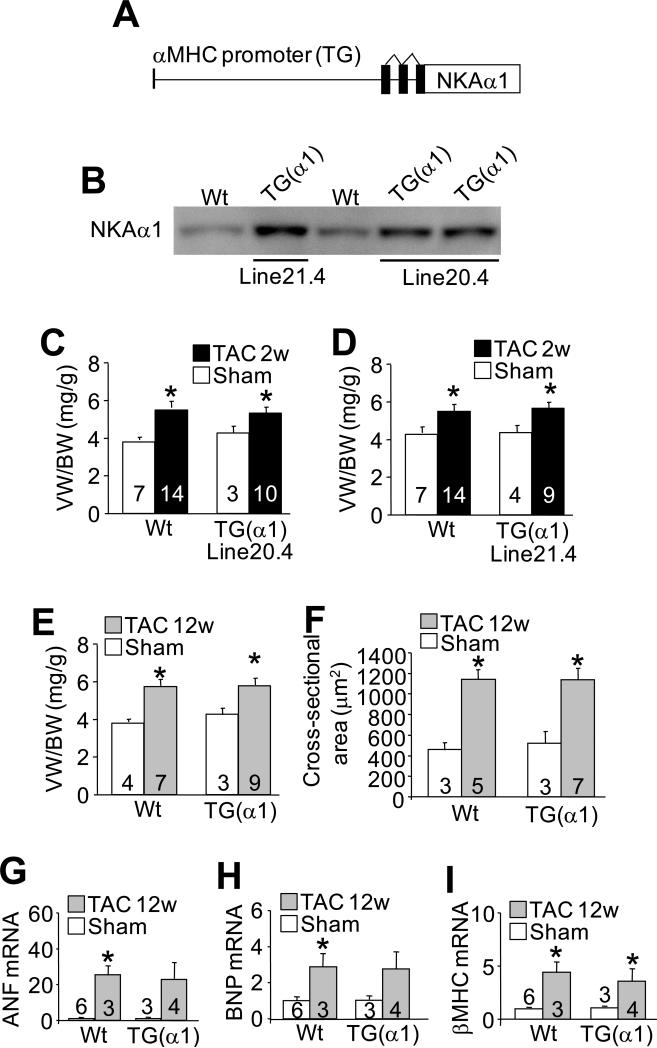
Figure 2. NKA-α1 transgenic mice show the same cardiac hypertrophic response after pressure overload as Wt mice.
A, Schematic representation of the transgene used to drive NKA-α1 expression in the mouse heart. B, Immunoblot for NKA-α1 protein from the hearts of Wt animals and 2 transgenic lines. Line 21.4 (high line) expresses more NKA-α1 protein than line 20.4 (low line). C-D, Ventricular weight to body weight ratios measured from Wt and line 20.4 or line 21.4 NKA-α1 transgenic mice after 2 weeks of TAC or a sham surgery. E, Ventricle weight to body weight ratios measured from Wt and high-line NKA-α1 transgenic mice after 12 weeks of TAC or a sham surgery. F, Histological analysis of myocyte cross-sectional area using wheat germ agglutinin-TRITC stain of heart histological sections from Wt and high-line NKA-α1 transgenic mice after 12 weeks of TAC or a sham surgery. G-I, mRNA levels of atrial natriuretic factor (ANF), brain natriuretic peptide (BNP) and β-myosin heavy chain (β–MHC) measured via qPCR from Wt and high-line NKA-α1 transgenic hearts after 12 weeks of TAC or a sham surgery. Wt controls were analysed after 10-12 weeks of sham surgery. For each experiment, number of mice analysed is given within the graph. *P<0.05 versus sham; #P<0.05 vs Wt TAC.

