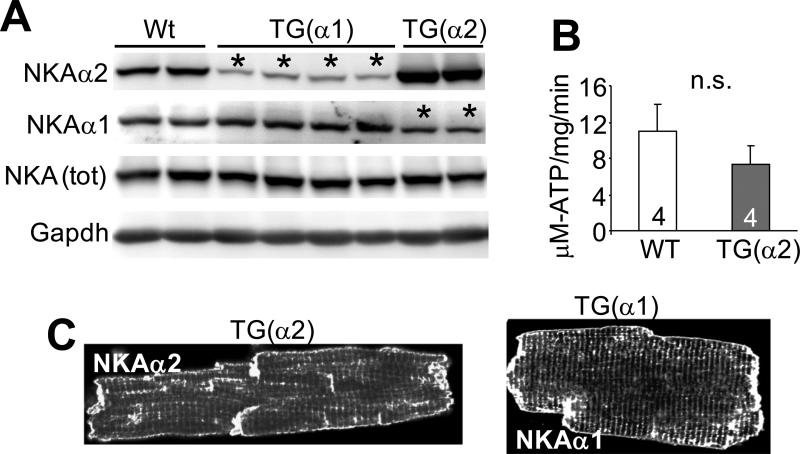
Figure 4. Compensation between NKA-α1 and NKA-α2 in the hearts of transgenic mice.
A, Immunoblots for NKA-α1, NKA-α2, total NKA and GAPDH protein from Wt and transgenic heart homogenates. The asterisks show the lanes with reduced NKA protein expression due to compensation. B, NKA activity measured as strophanthidin-sensitive ATP turnover rate in crude homogenates from Wt and NKA-α2 transgenic hearts. C, Subcellular localization of NKA-α1 and NKA-α2 protein in NKA-α1 or NKA-α2 isolated transgenic myocytes, respectively, via immunofluorescence and confocal microscopy. For each experiment, number of mice analysed is given within the graph. *P<0.05 versus sham; #P<0.05 vs Wt TAC.

