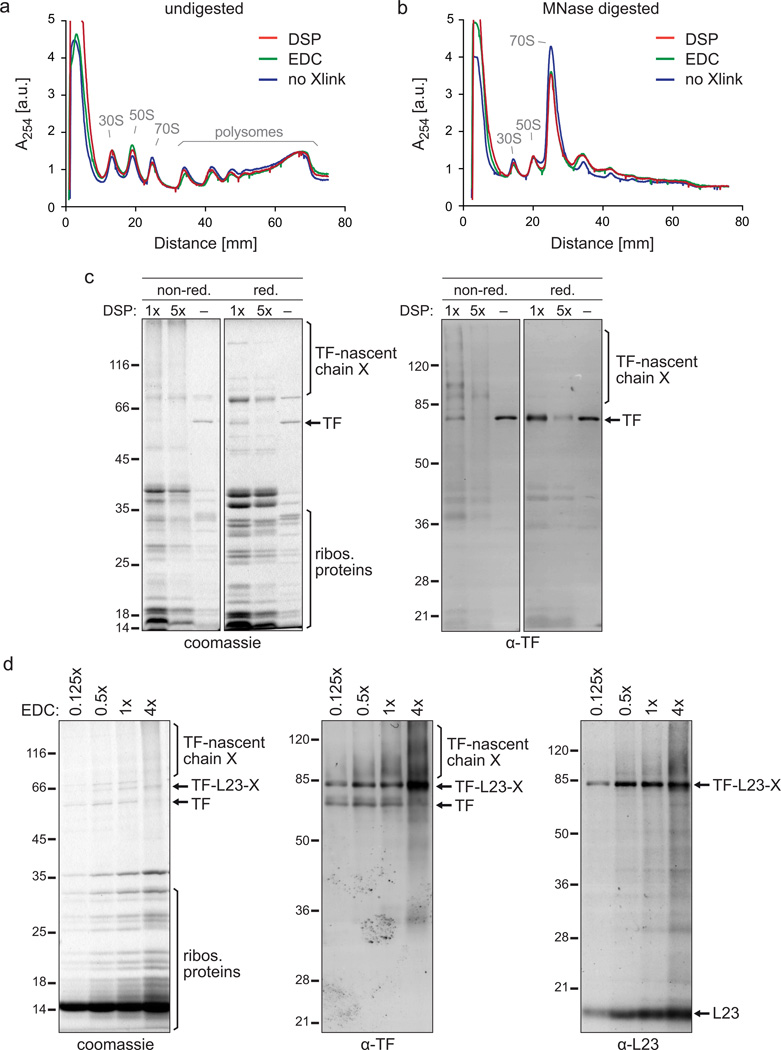
Figure 4.
The impact of crosslinking on the purification of TF–RNCs. (a,b) Polysome profiles in the absence of crosslinker or after DSP or EDC ex vivo crosslinking and sucrose gradient centrifugation. Depicted are data from experiments in which E. coli MC4100 cells were grown in LB medium and harvested as described in step 1, option C. The lysate was either crosslinked ex vivo with DSP or EDC (step 7, option B) or left untreated (step 7, option A). Undigested (a) and digested (b) lysates were run on a sucrose gradient (step 18, option B). The digestion was performed with a reduced MNase concentration of 15 U/A260 to partially retain di- and trisomes for comparison. ‘30S’ and ‘50S’ depict the peaks of the small and large ribosomal subunits, respectively. The monosome peak is labeled with ‘70S’. To compare polysome profiles quantitatively, the curves were normalized to the same area underneath all ribosomal peaks. (c) Gel analysis of the DSP crosslinker titration. 200 ml of E. coli MC4100 ∆tig::Kan + pTrc-tig-TEV-Avi cells were grown and harvested according to step 1, option A. Cells were resuspended in 2 ml of buffer A (50 mM HEPES pH 7.5, 1 M potassium acetate, 10 mM MgAc2, 1 mM PMSF, 1 mM chloramphenicol, 0.4% Triton X100, 0.1% NP-40, 1 mg/ml lysozyme, 2.5 µg/ml RNase-free DNase I). Lysis and purification of TF–RNCs was performed as described including DSP ex vivo crosslinking (step 7, option B) and sucrose cushion centrifugation (step 18, option A) with the following exceptions: For crosslinking either 3 mg of DSP (‘1×’), 15 mg of DSP (‘5×’) or DSMO only (‘−‘) were used. Ultracentrifugation was done with 1 M potassium acetate instead of 1 M NaCl in the sucrose cushion buffer causing the high amount of non-crosslinked TF that copelleted without DSP addition (‘−‘). For AP only half of Strep-Tactin slurry and TEV protease were used. Either non-reducing (‘non-red.’) or reducing (‘red.’) sample buffer was used for SDS-PAGE. Gels were stained with coomassie or used for western blotting employing a polyclonal α-TF antibody. Crosslinks are abbreviated with ‘X’. (d) Gel analysis of the EDC crosslinker titration. E. coli MC4100 ∆tig::Kan + pTrc-tig-TEV-Avi cells were grown in 1 l LB, harvested as described in step 1, option A, and resuspended in 6 ml of lysis buffer. Ex vivo crosslinking (step 7, option B) was performed with 2.5 mM (‘0.125×’), 10 mM (‘0.5×’), 20 mM (‘1×’) and 80 mM (‘4×’) EDC. TF–RNCs were purified as described, including sucrose cushion centrifugation (step 18, option A), eluted from the affinity matrix by boiling in reducing sample buffer, and analyzed by SDS-PAGE or western blotting using polyclonal antibodies against TF and L23. Crosslinks are abbreviated with ‘X’.

